Wednesday, February 28, 2007

Analysis: BET #1 Seed, Revisited

With one game to go for all 16 Big East teams, some of the BET seeding is clear, some is not. Best resources are MountaineerStats.com's Do-It-Yourself Prognosticator and this thread on Hoyatalk.

One point I want to address explicitly is that Georgetown controls its seeding fate Saturday against UConn.

If Georgetown and Pitt (@ Marquette) both win their last game, G'town is the #1 seed.
  • A Louisville win (@ SHU) would clinch for G'town (GU: 1-0, Pitt 0-1 vs. L'ville).
  • A L'ville loss and a Syracuse win (@ Villanova) would cancel the above advantage (GU 0-1, Pitt 1-0 vs. 'Cuse). Due to the uneven schedule and wins against most other teams, the eventual tie breaker, after progressing through all other teams one time, would be Notre Dame, which G'town beat and Pitt didn't play. G'town would receive the tiebreaker and #1 seed; yes, this doesn't seem fair, but it's how the tie-breaking formula is written.
  • A Syracuse loss would also clinch for G'town.

If Pitt and Georgetown both lose this weekend, G'town would receive the #1 seed.
  • A Louisville win would give a 3-way tie for first. G'town would win the mini-conference (GU 2-1; L'ville 1-1; Pitt 1-2), then Louisville at #2 and Pitt at #3.
  • A Louisville loss would result in tie-breaking scenarios as covered above, so G'town would be seeded #1, Pitt #2.

If Georgetown wins and Pitt loses, Georgetown is the #1 seed. Louisville would be #2 with a win, Pitt would stay #2 if Louisville loses.


If Pitt wins and Georgetown loses, Pitt is the #1 seed, Georgetown #2 (G'town holds a head-to-head tiebreaker with Louisville).

Tuesday, February 27, 2007

Analysis: Aftermath

It would have been hard to imagine three years ago that an opponent's fans, Syracuse fans no less, would storm the court and celebrate a win over Georgetown in their house. But times have changed, and expectations have changed around the Hilltop.

So the questions to ask are:
  • How bad was that lose?
  • How did it happen?
  • Will it happen again?

First, yes this loss was bad. But not the worst that the team has played this year. If you account for the level of the opponent (see previous post), this ranks as the Hoyas third worst game, behind the Old Dominion home loss and the Hartford win by only 10. Here's the performance chart for the season, updated through the 'Cuse game (click images to enlarge).


But the game was the first time since the Villanova & Pitt games in mid-January where G'town performed significantly below expectation (18 points below expected).

We can look at the offense and defense individually, as well. Here, I've adjusted my methodology from what I developed in an earlier post, so that now the offensive and defensive performance are expressed in point differential from expected (based on actual game pace) . This should give us an idea of where things went wrong.

First, the defense:
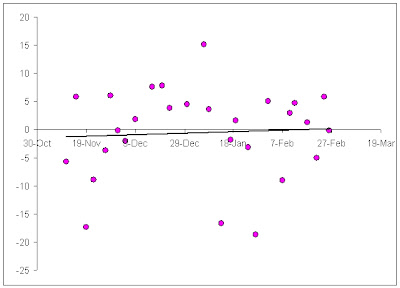

The results are a bit of a surprise, as the defense actually played right about as expected, given that it was a road game. While it seemed like the Orangemen were making everything they put up, their eFG% for the game (52.8) wasn't much different than what they typically shoot (51.4), the Georgetown held them well below average on OR% (24.3 vs. 34.2).

More interestingly, the team defense hasn't had a truly bad game since the home Cinci game on Jan. 27th (18 more points allowed than expected for G'town), when the Bearcats shot the lights out from 3 to keep the game close; more recently, Louisville scored 9 more points than expected, by not turning the ball over (1 time all game!).

The offense:
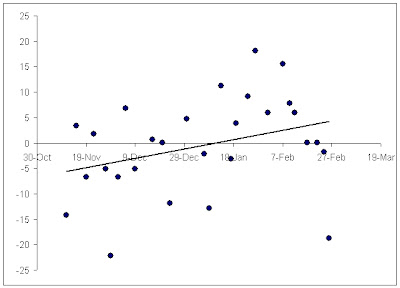

And here we can see just how ugly this game was; the offense was 19 points worse than expected. The heart of the matter was an eFG% of 35.1 (which includes those two late 3's in garbage time) almost 10% below than the next worst shooting performance (eFG% = 44.9 against Duke). That wasn't the only problem, as the team under-performed on turnovers and offensive rebounding, as well (although no where near the level of ineptitude of the shooting). At least they got to the FT line a bit more than usual.

Remarkably, this is not the lousiest offensive game for Georgetown, as the Hoyas achieved a -22 points (actual vs. expected) in the Oregon game. That was a real team effort, as all of the four factors were well below normal.


Having said all that, I'll return to the third question, "Will it happen again?" In a word, "No."

Warning - Heavy Statistical Content

Georgetown has an overall eFG% of 57.9 this season, good for 3rd in the country (through games played 2/26). And if you take the average eFG% of each game, it's even higher, 59.1 (this discrepancy has to do with the difference between treating all shots the same and treating each set of shots, i.e. each game, as a single event). The standard deviation of the game average is 8.1, so you can say the Hoyas' average eFG% = 59.1 ± 8.1 for the season (avg. ± 1σ).

Assuming a normal distribution across the 28 games played, there is a ~95% likelihood, or 19 in 20 chance, that Georgetown will perform within 2σ of their average (43 - 75% eFG). Up until the Syracuse game, the team's actual range was 44.9 (Duke) - 72.7 (James Madison). The likelihood that the Hoyas will shoot better than 35% eFG in a game is roughly 99.5%. That is to say, based upon the teams performance to date (including the Syracuse game), the shooting will be that bad 1 time in 200.

With a maximum of 10 games left in the season, the data indicates that Georgetown will not shoot that poorly again.
Monday, February 26, 2007

Final score: Syracuse 72, Georgetown 58

Georgetown vs Syracuse  
2/26/07 7:02 p.m. at Carrier Dome, Syracuse, NY  
Final score: Syracuse 72, Georgetown 58

Georgetown              Min   +/-   Pts  2PM-A 3PM-A FTM-A  FGA    A    Stl    TO   Blk    OR    DR   PF  
Summers, DaJuan        25:31  - 8  10/37 0 -5  1 -5  7 -8  10/37 0 /7  2 /45 1 /45 0 /16 2 /30 2 /19  3   
Green, Jeff            39:00  - 20 9 /52 2 -8  1 -5  2 -3  13/55 2 /12 1 /72 5 /72 2 /31 3 /42 7 /33  3   
Hibbert, Roy           19:19  - 7  6 /24 3 -4  0 -0  0 -0  4 /27 0 /5  0 /35 2 /34 3 /14 0 /19 2 /20  3   
Wallace, Jonathan      27:21  - 18 7 /35 0 -3  1 -4  4 -4  7 /39 0 /9  2 /46 4 /50 0 /21 1 /30 2 /23  2   
Sapp, Jessie           35:54  - 7  8 /55 2 -4  0 -8  4 -6  12/52 6 /14 2 /64 4 /65 1 /31 3 /39 3 /32  3   
Macklin, Vernon        09:18  - 6  2 /13 1 -1  0 -0  0 -0  1 /10 0 /4  0 /17 0 /17 0 /13 1 /5  0 /9   0   
Rivers, Jeremiah       16:45  - 3  3 /26 0 -0  1 -1  0 -0  1 /23 2 /7  2 /36 1 /33 0 /14 0 /17 3 /15  2   
Crawford, Tyler        02:54  + 3  0 /8  0 -2  0 -0  0 -0  2 /7  0 /2  0 /5  1 /7  0 /2  1 /7  0 /2   2   
SPANN, Octavius        01:00  + 6  3 /6  0 -0  1 -1  0 -0  1 /2  0 /1  0 /1  0 /2  0 /2  1 /1  0 /2   0   
Ewing, Patrick         22:58  - 10 10/34 3 -5  1 -1  1 -5  6 /33 2 /7  1 /44 3 /45 1 /21 2 /25 5 /20  3   
TOTALS                 40:00       58    11-32 6 -25 18-26    57 12/17 10/73 21/74 7 /33 17/43 26/35  21  
.                                        0.344 0.240 0.692       0.706 0.137 0.284 0.212 0.395 0.743      

Syracuse                Min   +/-   Pts  2PM-A 3PM-A FTM-A  FGA    A    Stl    TO   Blk    OR    DR   PF  
ROBERTS, Terrence      28:55  + 22 6 /57 2 -4  0 -0  2 -4  4 /38 0 /17 2 /54 1 /55 1 /25 1 /23 5 /32  2   
NICHOLS, Demetris      38:00  + 22 22/71 2 -8  4 -8  6 -6  16/51 1 /18 4 /69 2 /69 1 /31 1 /31 2 /42  2   
WATKINS, Darryl        32:06  + 7  9 /54 4 -4  0 -0  1 -5  4 /42 3 /14 0 /58 0 /58 2 /25 1 /28 7 /33  5   
RAUTINS, Andy          31:10  + 22 13/65 0 -0  4 -8  1 -2  8 /40 1 /17 2 /59 2 /58 0 /26 1 /24 2 /36  4   
DEVENDORF, Eric        39:39  + 14 11/72 4 -8  1 -4  0 -0  12/54 11/19 1 /73 6 /72 0 /32 0 /35 2 /43  5   
HARRIS, Paul           20:44  + 0  11/34 3 -7  0 -0  5 -8  7 /30 0 /9  1 /39 3 /37 0 /15 1 /21 5 /19  4   
BURACH, Todd           01:00  - 6  0 /0  0 -2  0 -0  0 -0  2 /2  0 /0  0 /2  0 /1  0 /0  1 /2  0 /1   0   
GORMAN, Matt           04:35  - 6  0 /4  0 -0  0 -1  0 -0  1 /7  0 /1  0 /10 0 /8  0 /3  0 /6  1 /6   0   
WRIGHT, Josh           03:03  - 2  0 /3  0 -0  0 -0  0 -0  0 /4  0 /1  0 /5  2 /6  0 /3  0 /3  0 /2   1   
DiLIEGRO, Ross         00:48  - 3  0 /0  0 -0  0 -0  0 -0  0 /2  0 /0  0 /1  0 /1  0 /0  0 /2  0 /1   0   
TOTALS                 40:00       72    15-33 9 -21 15-25    54 16/24 10/74 16/73 4 /32 9 /35 26/43  23  
.                                        0.455 0.429 0.600       0.667 0.135 0.219 0.125 0.257 0.605      

Efficiency: Syracuse 0.986, Georgetown 0.784
eFG%: Syracuse 0.528, Georgetown 0.351
Substitutions: Syracuse 20, Georgetown 30

2-pt Shot Selection:  
Dunks: Syracuse 1-1, Georgetown 3-3
Layups/Tips: Syracuse 11-18, Georgetown 5-10
Jumpers: Syracuse 3-14, Georgetown 3-19

News: Syracuse 72, G'town 58

As The Stranger once explained to The Dude, "Sometimes you eat the bear, and sometimes, well, he eats you."

Not much too add tonight besides the box score. Before Pat Ewing Jr. and Tay Spann (!) hit back-to-back 3s to end the game, the team shot a collective 15-55 (4-23 3-pt). That's an eFG% of 30.1% going into the last minute. The worst performances before today were 44.9% at Duke and 45.9% vs. Oregon.

If you feel the need to vent, head over to this thread on HoyaTalk.

Pre-Game Analysis: GU vs. Syracuse

With history to be made by the 2006-07 Georgetown Hoyas, it is fitting that the game that could clinch a share of the Big East regular season title and a program record 12th straight win comes against rival Syracuse in the Carrier Dome. After beating Pittsburgh to take the lead in the Big East on Saturday, a victory tonight will give Georgetown all of the necessary tie-breakers to secure the No. 1 seed in the Big East Tournament.

Despite a Syracuse team that has played weaker than many previous incarnations, the Orange will present a formidable challenge, not only given their rivalry with the Hoyas, but also the status of their postseason hopes. Even after four straight wins, Syracuse currently resides firmly on the bubble after a pre-conference schedule yielded no wins of note. A win tonight, paired with an earlier win over Marquette, would give them two quality victories on the season, as well as 10 wins in the Big East, which should be enough to get them into the tournament provided they don't lose to Villanova and again in the first round of the Big East Tournament. Coupling that desire with a quick turnaround after Saturday's game, bad traveling conditions on Sunday for Georgetown and an arena in which the Hoyas have not won since 2002 is probably why Washington Post columnist Mike Wilbon picked the Orange to upset the Hoyas on Tony Kornheiser's radio show Monday Morning.

The Hoyas do have momentum, having won 11 in a row, as well as a sterling road resume. Winners of 9 of 11 games on the road this season, Georgetown owns the most visiting victories of any major conference team this season. Those two losses came to Duke (at Cameron Indoor) and to Pittsburgh (at the Peterson Events Center) two of the toughest venues in college basketball. The Carrier Dome, with its high crowd capacity and vacuous feel, could be an equally daunting environment, especially considering that Georgetown will likely have to have a solid game from behind the arc to win. In seven of Syracuse's eight losses, they allowed eight or more three pointers to their opponents.

While Georgetown is third in the Big East in three-point field goal percentage (just behind Syracuse), the Hoyas have only scored eight or more threes three times during conference play this season (Cincinnati, DePaul and Notre Dame). The Hoyas prefer to pound the ball inside to center Roy Hibbert and floating post man Jeff Green. To do that, they will have to dissect the Orange's trademark 2-3 zone. Expect Green to cut frequently to the foul line. If he gets the ball in the high post, Green will be a extremely problematic for Syracuse. He's been very adept of late at knocking down mid-range jump shots, and his vision and passing skills will allow him to dump it down to the low post or to an open teammate behind the arc if his shot isn't there.

Jon Wallace, who arugably turned in the best game of his career against Pittsburgh, will have to provide some shooting touch from the perimeter, as the streaky Summers has been cool of late, hitting just one of his last 13 three-point attempts since a torrid four of six clip in wins over Marquette and West Virginia.

Defensively Georgetown will have to bottle up Big East scoring leader Demetris Nichols and Eric Devendorf. The Hoyas have employed a very effective 2-3 zone of late, but don't be surprised to see defensive catalyst Patrick Ewing Jr. take on Nichols in man-to-man sets. Syracuse freshman Paul Harris could be an X factor for the Orange. Head Coach Jim Boeheim has largely kept the highly-regarded Harris in check this season, but after scoring 16 points against UConn Feb. 17, he was rewarded with 32 minutes of playing time against Providence last Saturday. He only scored six points in that time against the Friars, but he has had a knack for getting to the foul line this season. Boeheim may insert him if he is looking to get Green or Hibbert to the bench with foul trouble.

Sunday, February 25, 2007

Analysis: BE Regular Season vs. BE Tourney

Something that's been brought up a few times on HoyaTalk is the relative merits of winning the Big East regular season title and/or league tourney title.

I thought I'd look at the performance of the top 2 regular season (RS) teams and BET finals (F) teams in the NCAAs, to see if any pattern emerges. Overall, regular season 1st or 2nd place teams average 2.2 wins the the NCAA, while BET finalists average 1.9 wins.

I broke the teams into 8 groups. For example, a team that finished 1st in the regular season, and lost the BET finals game will be labeled: (#1, #2), followed by count (number of teams) and average NCAA wins. Okay, here we go:

Team

Count

Average

(#1,#1)

11

2.6

(#1,#2)

8

2.0

(#1,no)

8

2.1


(#2,#1)

7

3.0

(#2,#2)

6

1.7

(#2,no)

14

1.6


(no,#1)

9

0.9

(no,#2)

14

1.8


For top-2 teams from the regular season, there does seem to be a correlation between winning the BET title and playing well in the NCAAs. Generally, RS 1st place teams do slightly better than 2nd (2.3 vs. 2.0), but the 2nd place team that wins the BET is the strongest of all groups (noting small sample sizes).

On the other hand, finishing worse than 2nd in the regular season but winning the BET does not appear to be a precursor to an NCAA run (think 'Cuse last season). But strangely, a team that finished 3rd or worse regular season, then lost the BET finals is just short of even odds to make the Sweet 16, on average.

Extra: Pitt Highlights

New link to game highlights (higher quality than below).

Saturday, February 24, 2007

Final score: Georgetown 61, Pittsburgh 53

  PITT vs Georgetown 
02/24/07 2 p.m. at Verizon Center, Washington, D.C.
Final score: Georgetown 61, PITT 53

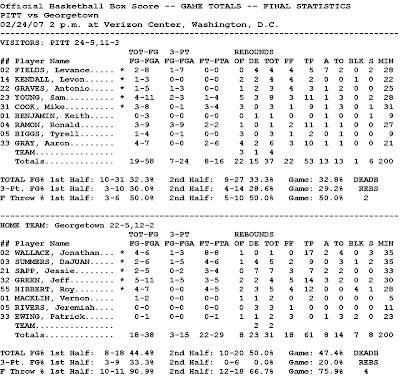
PITT Min +/- Pts 2PM-A 3PM-A FTM-A FGA A Stl TO Blk OR DR PF
FIELDS, Levance 28:54 + 5 5 /45 1 -1 1 -7 0 -0 8 /44 7 /14 2 /44 2 /45 0 /16 0 /33 4 /17 4
KENDALL, Levon 21:21 + 3 2 /32 1 -3 0 -0 0 -0 3 /34 0 /10 0 /31 1 /32 1 /10 2 /25 2 /11 4
GRAVES, Antonio 24:35 - 1 3 /36 0 -2 1 -3 0 -0 5 /36 1 /12 0 /36 2 /34 0 /15 1 /27 2 /15 4
YOUNG, Sam 28:09 - 3 11/40 2 -8 2 -3 1 -4 11/38 1 /11 2 /44 3 /41 0 /19 5 /27 3 /15 3
COOK, Mike 31:11 - 4 9 /41 3 -7 0 -1 3 -4 8 /43 1 /12 1 /46 3 /47 0 /20 3 /32 0 /18 1
BENJAMIN, Keith 09:19 - 6 0 /8 0 -3 0 -0 0 -0 3 /13 1 /3 1 /12 0 /10 0 /4 0 /10 1 /5 0
RAMON, Ronald 26:21 - 19 11/29 0 -0 3 -9 2 -2 9 /41 1 /7 0 /40 1 /39 0 /14 1 /36 0 /14 2
BIGGS, Tyrell 08:39 - 6 2 /6 1 -3 0 -1 0 -0 4 /15 0 /1 0 /12 1 /13 0 /3 3 /15 0 /6 1
GRAY, Aaron 21:31 - 9 10/28 4 -7 0 -0 2 -6 7 /26 1 /6 0 /30 1 /29 0 /14 4 /20 2 /14 3
TOTALS 40:00 53 12-34 7 -24 8 -16 58 13/19 6 /59 14/58 1 /23 22/45 15/23 22
0.353 0.292 0.500 0.684 0.102 0.241 0.043 0.489 0.652

Georgetown Min +/- Pts 2PM-A 3PM-A FTM-A FGA A Stl TO Blk OR DR PF
Wallace, Jonathan 35:34 + 7 17/55 3 -3 1 -3 8 -8 6 /34 2 /12 3 /53 4 /53 0 /29 1 /21 0 /40 0
Summers, DaJuan 34:22 + 10 9 /56 1 -1 1 -5 4 -6 6 /34 0 /14 2 /49 3 /51 1 /33 1 /21 4 /40 2
Sapp, Jessie 33:04 + 9 7 /51 2 -3 0 -2 3 -4 5 /30 2 /13 0 /49 2 /50 0 /31 0 /18 7 /40 3
Green, Jeff 29:22 + 5 14/43 4 -6 1 -5 3 -5 11/27 3 /9 2 /43 2 /44 0 /25 2 /15 2 /30 5
Hibbert, Roy 28:41 - 3 12/38 4 -7 0 -0 4 -5 7 /24 0 /7 1 /39 0 /42 4 /23 2 /16 3 /32 4
Macklin, Vernon 04:46 - 2 2 /6 1 -2 0 -0 0 -0 2 /5 0 /1 0 /8 0 /5 0 /3 1 /3 1 /5 0
Rivers, Jeremiah 11:22 + 0 0 /16 0 -0 0 -0 0 -0 0 /12 0 /5 0 /14 0 /15 0 /8 0 /7 3 /10 1
Ewing, Patrick 22:49 + 14 0 /40 0 -1 0 -0 0 -1 1 /24 1 /11 0 /35 4 /35 2 /18 1 /14 1 /28 3
TOTALS 40:00 61 15-23 3 -15 22-29 38 8 /18 8 /58 15/59 7 /34 8 /23 23/45 18
0.652 0.200 0.759 0.444 0.138 0.254 0.206 0.348 0.511

Efficiency: Georgetown 1.034, PITT 0.914
eFG%: Georgetown 0.513, PITT 0.388
Substitutions: Georgetown 23, PITT 37

2-pt Shot Selection:
Dunks: Georgetown 1-1, PITT 2-2
Layups/Tips: Georgetown 7-8, PITT 7-17
Jumpers: Georgetown 7-14, PITT 3-15

Analysis: BET Seeding Possibilites

After Saturday's BE games, Georgetown currently stands at 12-2, alone in first place in the conference. Pitt (11-3) and Louisville (10-4), with less than 5 losses, are the other teams still in play for the regular season conference title. Here are the remaining scenarios that would give Georgetown at least a share of the regular-season title, and a #1 seed:

Hoyas 2-0 (W @ Syracuse, v. UConn)
  • Louisville holds the tie breaker vs. Pitt (head-to-head 1-0), and could obtain the #2 seed by winning at least one more remaining game than Pitt.
  • If Pitt loses out, ending 11-5, Notre Dame could pass them by reaching 11 wins. Notre Dame would win any tiebreaker against L'ville and/or Pitt.
Hoyas 1-1 (W @ 'Cuse, L v. UConn)

Hoyas 1-1
(L @ 'Cuse, W v. UConn)
  • Pitt 1-1 or worse
  • Pitt 2-0 and 'Cuse loses at Villanova. If Pitt goes 2-0, Georgetown and Pitt would end tied. Since they split head-to-head, the next tiebreaker is best record against next best team. Georgetown has a 1-0 record against all possible next best teams, except Syracuse (currently 0-0). Pitt beat 'Cuse in their only meeting, so would win this tiebreaker against G'town.
Hoyas 0-2
  • Pitt 1-1, L'ville 2-0. In case of a three-way tie for first, G'town would win the mini-conference by best combined head-to-head record (GU 2-1; L'ville 1-1; Pitt 1-2).
  • Pitt 0-2. Georgetown holds a head-to-head tiebreaker against L'ville (and therefore the Cardinals cannot be seeded higher than G'town under any scenario).


Georgetown will fall to the #2 seed (Pitt #1), but share the regular-season title if:

Hoyas 1-1 (L @ 'Cuse, W v. UConn)
  • Pitt 2-0 and 'Cuse wins at Villanova. See above.
Hoyas 0-2
  • Pitt 1-1, L'ville 1-1 or worse, and 'Cuse wins at 'Nova. See above.


Georgetown will fall to the #2 seed and lose the regular-season title if:

Hoyas 0-2
  • Pitt 2-0

I think that's everything - let me know what I missed.

News: G'town 61, Pitt 53


Check this thread on HoyaTalk for post-game article links (thanks, as always, to the inimitable Dan McQ).

Looking at the official box score, Pitt had a remarkable 58-38 FGA advantage. How did it happen? Offensive rebounding (22-8).

Using Pomeroy's method for calculating possessions:

Pitt = 58 FGA - 22 OR + 13 TO + 16 FTA * 0.475 = 60 possessions
GU = 38 FGA - 8 OR + 14 TO + 29 FTA * 0.475 = 58 possessions


So the game had ~59 possessions , right in line with G'town's average pace of 59.2 coming into the game.

Georgetown's Off. Eff. was ~104, about 16% better than Pitt allows on average (and about 18% worse than G'town averages). The Hoyas' Def. Eff. was ~90, about what where they've performed this season [91], but 24% below Pitt's offensive season average.

Georgetown was able to win by getting to the line (29-16 advantage, or a 76.3 - 27.6 FT Rate advantage, if you're so inclined) and by shooting a higher percentage (51.3 - 38.8 eFG%).

Watching the game, it seemed that the majority of the GU turnovers occurred in the first 10 minutes of the game, while Pitt made several turnovers late that cost them the game. So I'd suggest that the nearly even TO stat in the box score is a bit misleading.

Friday, February 23, 2007

Pre-Game Analysis: GU vs. Pitt (2/24/07)

The last time these two teams met, Georgetown held Aaron Gray to 11 pts. and 4 reb., shot 60-percent from the field ... and lost. So what accounted for the 74-69 Pitt victory at Peterson Events Center? To reference Rockaway's earlier post, it may have been Mighty Mo.

From the 1:32 mark in the first half to the 17:16 mark in the second, Pittsburgh took a five point lead and grew it to 15. Every time Georgetown would pull within striking distance from then on, Pitt would extend the lead, largely through the play of their guards. Led by Mike Cook's 18 points, his high water mark on the season, the Panthers attacked Georgetown's defense, using quick passes to find open teammates (22 assists on 28 field goal attempts) or earning a trip to the free throw line, where they hit 15 of 19 free throws.

Since that game, the Hoyas have embarked on a 10-game winning streak and are now playing their best basketball of the season. Georgetown tops the Big East in scoring defense at 57.9 points allowed per game, and held Marquette and West Virginia under 60 points in two victories.

Part of that can be attributed to a more patient Hoya defense. Rather than biting on ball fakes and over pursuing as they did early in the season, Georgetown defenders are staying put, satisfied with creating poor shooting opportunities rather than turnovers. The Hoyas have been clogging the passing lanes and funnelling their opponents towards shot blockers Roy Hibbert and Jeff Green. It will be interesting to see if Pitt's guards are able to get the Hoyas to chase them, or if a more static defense can tame a Panther offense that shot 59.6 percent in the teams' first meeting.

As the rematch at Verizon Center approaches on Saturday, ESPN's Andy Katz and the Associated Press are reporting a strong possibility that Gray may not be ready to go after suffering a foot/ankle injury in the late minutes of last weekend's non-conference game with Washington. Absent the seven-footer on Monday, Pitt narrowly escaped an upset at the hands of Seton Hall, 71-68. Of course, the statements could just be gamesmanship on the part of Pitt Head Coach Jamie Dixon.

While Gray's absence may not affect the guard play that troubled Georgetown last time, it may swing the rebounding edge dramatically towards the Hoyas. While Pitt held a 18-15 advantage on the boards against Georgetown, it struggled mightily without their seven-foot center against a poor-rebounding Seton Hall team, claiming 31 caroms to the Pirates' 30. That would be the same Seton Hall team that the Hoyas out-rebounded 38-8 earlier this season.

If Gray were to miss the game, Dixon could try to go small and push the tempo, though that is not Pitt's style. Like the Hoyas, the Panthers prefer to play the possession game, averaging 67.3 ppg this season, while allowing just 59. 1. However, a possession-style game without Gray in the middle would strongly favor Georgetown. If Dixon thinks a change is needed, it's possible he could try to double- or triple-team Hibbert, as Cincinnati did this past Wednesday when the Bearcats held him to seven points on four field goal attempts.

With or without Gray, expect a hard-nosed game at Verizon Center, with Pitt's guards trying to take the ball at both Hibbert and Green to try to draw fouls and force them to the bench. The Panthers (.392 percent from behind the arc, No. 2 in the Big East behind Georgetown) could launch a long range assault too. Cincinnati had early success against Georgetown with a barrage of three-pointers before the Bearcats' poor-execution (two points in the last 4:19 of the first half and 17 turnovers in the game) allowed Georgetown back in the game. A similar start from a better-controlled, better-shooting team, like Pitt, could spell trouble for the Hoyas.

If Georgetown is allowed to control the tempo and Green and Hibbert establish themselves, however, Pitt will have plenty of problems at Verizon Center, seven-foot Player of the Year candidate or no.

Thursday, February 22, 2007

Analysis: What is determining performance?

A couple of earlier posts had looked at Ken Pomeroy's work correlating Offensive and Defensive Efficiencies with pace and/or the "four factors," and determining how well Georgetown performed in each game versus the expected result, based on opposition.

I thought I'd try to bring these two ideas together, to see which component(s) of Georgetown's offense or defense are determining how well the Hoyas actually play.

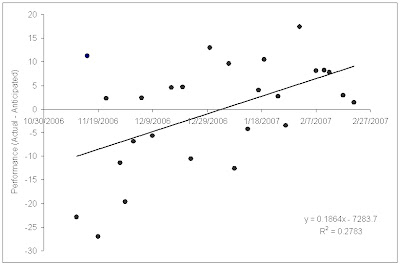
I'm going to call the point difference between actual points scored and expected (via Pomeroy methods) performance. So, if I plot performance over the course of the season:


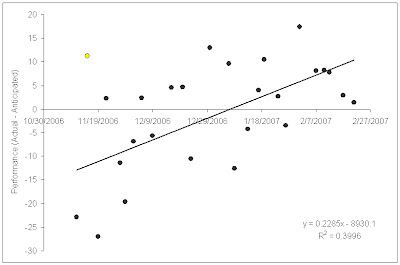
This looks like a nice improvement as the season has progressed (ignore that leveling off from the last two games), although that early season win at Vanderbilt is a bit anomalous. Now I don't want to get into residual analysis here, but, for shits and grins, let's pull the Vandy game out and re-run the plot:


The slope of the line increases about 20%, and the R^2 is up 40%. Hopefully, someone videotaped that Vandy game and will write up what the team did right.

Anyway, now that we can see how much the team has improved, I thought I'd try to find a correlation between performance and any of the underlying statistics that Pomeroy provides.

First, let's re-post KenPom's table or correlations between Off. Eff. / Def. Eff. and components, now updated through 2/21:
                  Correlations
to OE to DE
Pace: -0.40 -0.18

eFG%: +0.71* -0.09
OR%: +0.35 -0.22
TO%: -0.60* -0.44
FTR: +0.13 -0.09

Opp eFG%: +0.20 +0.77*
Opp OR%: -0.25 +0.55*
Opp TO%: -0.17 -0.37
Opp FTR: -0.32 +0.28

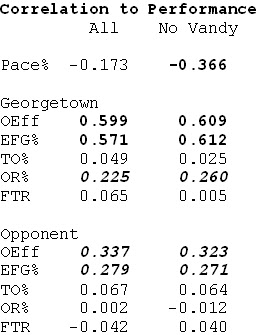
These work quite well, but the question is whether these same correlations hold when we're looking for correlations to performance rather than efficiency. If it's simply a question of subtracting Off. Eff. from Def. Eff., you'd expect that eFG%, TO% on offense, and eFG% and OR% on defense would be the keys.

Here's what I get:


These are some interesting results. Overall, Off. Efficiency, and less so Def. Efficiency (or opponent's Off. Eff. in this case), are well correlated, as we'd expect. The especially strong correlation between the offense and performance shouldn't be a surprise. Georgetown has the most efficient offense in the country, so you'd expect that to be the primary weapon.

What's more interesting is what some of the contributing underlying factors are: namely eFG%, which we expected (thank you Roy Hibbert and Jon Wallace), but OR% rather than TO%. So it looks as if the team is able to overcome the high turnover rate, while good rebounding effort is still important. Defensively, only eFG% has any sort of strong correlation, which is a real surprise to me - I expected the defensive rebounding (opponent's OR%) to be very important. Hmmm.

The only other note is that, if we ignore the Vandy game, forcing the opponent to play slower than they like like (pace% = game pace / opp. normal pace) seems to help.

Analysis: Wallace Time

Every college basketball fan enjoys the dramatics of end-game heroics. As a Hoya fan who started following the team the year after the 2001 NCAA run, two last-second shots stick out in my mind: Roy Hibbert's dunk at the buzzer against Notre Dame in 2005, and of course the Nat Burton shot in the NCAA tournament, whose legend continues to grow each and every year as the calendar turns to March.

But the truth is, most games aren't won during the final seconds. Basketball is a game of momentum. The team that is best able to seize it during opportune times greatly increases their chances of winning the game. In basketball, the most important periods of the game to maximize the effectiveness of riding a wave of momentum come at the end of the first half and beginning of the second half. How a team finishes the first half and starts the second half is crucial; if a deficit is erased or a lead is stretched into double digits, the team is riding a wave of position emotion into the locker room, which can only help boost confidence and possibly demoralize the other team. During the Hoyas' current winning streak; it has happened several times (@St. John's, @DePaul, and @Nova being the most vivid examples).

So who has stepped up for the Hoyas during these extremely important times of the game? On several occasions in HoyaChat, I've dubbed the last two minutes of the first half and the first two minutes of the second half "Wallace Time," due to Jon's uncanny ability to knock down shots during those vital four-minute periods. But just how effective has Wallace been? Has he really been shooting that well, or am I just noticing all the makes and ignoring all the misses? My curiosity led me to compile these stats, which I found very interesting:

First, let's take a look at Wallace's total shooting numbers for the year:

2PT%: 53.3% (49 for 92)
3PT%: 48.0% (48 for 100)
FG%: 50.5% (97 for 192)
FT%: 89.1% (49 for 55)
Total: 291 points

Initially, I compiled Wallace's shooting statistics during the last two minutes of the first half and first two minutes of the second half for the out-of-conference schedule only (13 games):

2PT%: 75.0% (3 for 4)
3PT%: 37.5% (3 for 8)
FG%: 50.0% (6 of 12)
FT%: 100% (2 for 2)
Total: 17 points

Solid numbers in the OOC, but nothing out of the ordinary for Wallace this year. However, contrast those numbers to those during the same time period during games, but for conference games only (13 games):

2PT%: 66.7% (4 for 6)
3PT%: 88.9% (8 for 9)
FG%: 80.0% (12 for 15)
FT%: 100.0% (1 for 1)
Total: 33 points

Wallace has been incredibly important to the Hoyas during the Big East schedule in terms of changing momentum with clutch shots. If it's seemed like he's never missed during the last two minutes of the first half and the first two minutes of the second half during our winning streak, well, it's probably because he rarely did. At Wallace's current average of 11.2 points per game, this would have assumed that he would have scored roughly 145 total points for just BE games. Having scored 33 points during this 4-minute interval in all BE games combined, he is averaging approximately 22.8% of his expected scoring output during this period, which spans only 10% of the game.

Here are Wallace's shooting numbers for the entire season during the aforementioned 4 minute time period of games:

2PT%: 70.0% (7 for 10)
3PT%: 64.7% (11 for 17)
FG%: 66.7% (18 for 27)
FT%: 100.0% (3 for 3)
Total: 50 points

All of these numbers are significantly higher than what he is shooting for the entire season. And as great as these statistics are, they might still take a backseat to the shifts in momentum that Wallace provides when the team badly needs a bucket to whittle away a deficit or take a lead. It's impossible to measure his influence on games in that sense by merely using shooting percentages. Certainly, he has changed the dynamic of more than a few games this season not with just the increased accuracy of his shots, but also the timeliness of when they occur.

Simply put, Jon Wallace is clutch.

Wednesday, February 21, 2007

Final score: Georgetown 75, Cincinnati 65

  Georgetown vs Cincinnati  
02/21/07 7:00 pm at Cincinnati, Ohio (Fifth Third Arena)
Final score: Georgetown 75, Cincinnati 65

Georgetown Min +/- Pts 2PM-A 3PM-A FTM-A FGA A Stl TO Blk OR DR PF
Summers, DaJuan 35:02 + 11 6 /67 2 -3 0 -4 2 -2 7 /40 0 /21 2 /56 2 /55 0 /32 0 /17 4 /38 1
Green, Jeff 29:24 - 2 21/53 4 -7 2 -3 7 -8 10/34 2 /11 0 /48 1 /49 1 /26 1 /18 2 /28 3
Hibbert, Roy 32:10 + 7 7 /58 3 -4 0 -0 1 -2 4 /42 2 /18 0 /50 1 /48 1 /24 3 /21 6 /28 5
Wallace, Jonathan 36:28 + 8 17/65 3 -4 3 -6 2 -2 10/45 2 /17 1 /57 6 /57 0 /34 1 /21 0 /34 2
Sapp, Jessie 36:30 + 1 14/64 5 -9 1 -4 1 -5 13/43 4 /16 1 /59 2 /58 0 /31 2 /21 4 /34 2
Macklin, Vernon 03:02 + 2 2 /6 1 -1 0 -0 0 -0 1 /4 0 /2 0 /5 0 /6 0 /4 0 /0 0 /3 1
Rivers, Jeremiah 07:02 + 11 6 /21 0 -0 2 -2 0 -0 2 /8 1 /5 0 /12 0 /11 0 /5 0 /2 0 /10 2
Crawford, Tyler 02:29 + 9 0 /11 0 -0 0 -0 0 -0 0 /4 0 /4 0 /4 0 /4 0 /2 0 /0 0 /2 0
Ewing, Patrick 17:53 + 3 2 /30 0 -0 0 -1 2 -2 1 /20 2 /10 1 /29 2 /27 3 /17 0 /10 1 /18 3
TOTALS 40:00 75 18-28 8 -20 15-21 48 13/26 5 /64 16/63 5 /35 9 /21 18/37 19
0.643 0.400 0.714 0.500 0.078 0.254 0.143 0.429 0.486

Cincinnati Min +/- Pts 2PM-A 3PM-A FTM-A FGA A Stl TO Blk OR DR PF
WILLIAMSON, John 37:31 - 2 15/65 7 -11 0 -0 1 -3 11/55 1 /16 0 /58 6 /61 0 /27 4 /36 2 /20 2
SIKES, Marcus 29:27 - 9 9 /45 2 -7 1 -3 2 -4 10/41 1 /13 1 /47 3 /49 0 /20 4 /29 2 /17 4
GENTRY, Marvin 26:24 - 8 6 /38 0 -2 2 -4 0 -0 6 /34 1 /13 0 /39 1 /38 0 /18 0 /21 0 /14 3
CROWELL, Timmy 21:36 - 2 5 /31 1 -2 1 -1 0 -0 3 /30 2 /9 2 /29 1 /31 0 /13 2 /21 3 /15 1
VAUGHN, Deonta 33:28 + 5 19/59 2 -8 3 -13 6 -8 21/52 5 /15 4 /54 1 /57 0 /24 3 /36 1 /20 4
BARWIN, Connor 12:24 - 10 3 /16 1 -2 0 -0 1 -1 2 /17 0 /5 1 /19 2 /15 0 /9 1 /11 1 /7 2
MILLER, Branden 02:04 + 0 0 /6 0 -0 0 -0 0 -0 0 /4 0 /2 0 /4 0 /4 0 /0 0 /2 0 /2 1
McGOWAN, Cedric 18:42 - 16 5 /31 1 -2 1 -2 0 -0 4 /29 0 /8 0 /31 0 /32 0 /14 1 /21 0 /8 2
WARREN, Jamual 18:24 - 8 3 /34 1 -1 0 -0 1 -2 1 /28 3 /11 1 /34 3 /33 0 /15 1 /18 2 /7 0
TOTALS 40:00 65 15-35 8 -23 11-18 58 13/23 9 /63 17/64 0 /28 19/37 12/21 19
0.429 0.348 0.611 0.565 0.143 0.266 0.000 0.514 0.571

Efficiency: Georgetown 1.190, Cincinnati 1.016
eFG%: Georgetown 0.625, Cincinnati 0.466
Substitutions: Georgetown 45, Cincinnati 45

2-pt Shot Selection:
Dunks: Georgetown 0-0, Cincinnati 1-1
Layups/Tips: Georgetown 11-14, Cincinnati 7-14
Jumpers: Georgetown 7-14, Cincinnati 7-20

News: Other Big East Scores 2/21

Louisville 72, St. John's 48
The Cardinals are just playing for seeding at this point. Barring calamity, St. John's should still make the BET this year.

UConn 65, Rutgers 55
And with that loss, Rutgers slips below 200 in RPI. UConn has only beaten 1 conference opponent ('Cuse) with an RPI better than 100.

News: Georgetown 75, Cincinnati 65

An ugly win on the road, moving Georgetown to 11-2 in the Big East.

Here's the G'town side of the box score:

STARTERSMINFGM-AFTM-AOFFREBASTPFPTS
D. Summers, F352-72-204016
J. Green, F296-107-8132321
R. Hibbert, C323-41-239247
J. Wallace, G366-102-2112217
J. Sapp, G376-131-5264214
BENCHMINFGM-AFTM-AOFFREBASTPFPTS
V. Macklin, F41-10-000012
J. Rivers, G72-20-000136
T. Crawford, G-F20-00-000000
P. Ewing Jr, F180-12-201232
TOTALSFGM-AFTM-AOFFREBASTPFPTS

26-4815-21724131975

Notes:
  • Jessie Sapp accounted for 4 of the 5 missed FTs (3 in the last minute)
  • Not listed, but Jon Wallace accounted for 6 of the team's 14 turnovers
  • Georgetown gave up 16 offensive rebounds on (Def OR% = 48.5%)
My calculated efficiency numbers for the game (always subject to change):

Corrected 2-22-07
Pace = 64
Off. Efficiency = 116.3
Def. Efficiency = 100.8

Tuesday, February 20, 2007

News: Big East Scores - 2/20

Notre Dame 78, DePaul 54
NDU takes a step towards solidifying their tourney hopes, and possibly ends DePaul's chances in the process. Even if DePaul wins out (S. Fl. and Cinci), their RPI can't move up.

Providence 64, WVU 61
Meanwhile, Provy keeps hope alive, thanks to WVU shooting 9-41(!) on 3-pts. Now if Provy wins out (Cuse, @ S. Fl., @ St. John's), they'ed be 10-6, with an RPI in the low 40's.

Analysis: Team Performance

In the last analysis post, I looked at whether the team had improved on offense or defense, and tried to tease out some underlying reasons.

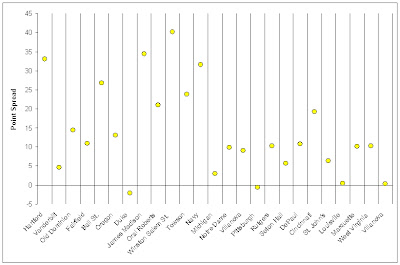
Today, I thought I'd try to look more coarsely at that analysis. First, I can retroactively calculate the expected point spread, based on Adj. Off. Eff. and Adj. Def. Eff. from Ken Pomeroy. Now this won't perfectly reproduce his original point spreads, since his efficiencies are based on performance throughout the season, weighted toward the present. But, it'll give an idea of the level of competition for each game the Hoyas played. Note that I'm weighted +4 for home and -4 for road. Also, I'm cheating, and applying the pace that the game was played at to calculate points, rather than efficiencies (as always, click any image to enlarge).


Things are definitely going well for Georgetown these days. Based on play so far this season, the Hoyas would only be underdogs for the Duke and Pitt road games.

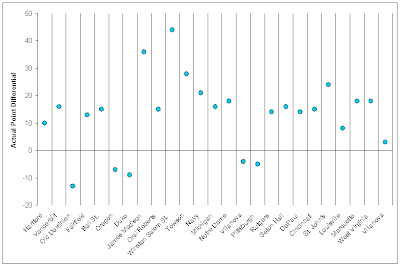
Well, we can bring reality into our hypothetical world, simply by plotting the actual point differential for all the games played to date:


Strange as it is, ODU still has the best (worst?) point differential against the Hoyas this season.

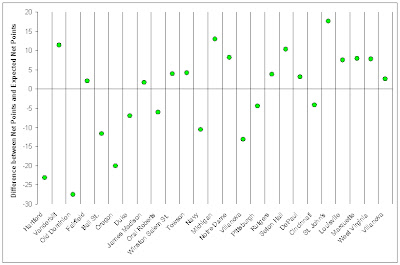
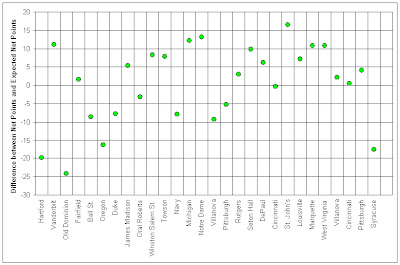
Okay, now if I simply subtract the first chart from the second, we should get a measure of how well G'town played in each game, relative to where we'd expect based on today's offensive and defensive efficiencies.


Well, by this metric that ODU game is still the worst that Georgetown has played this year, but the first game of the year, against Hartford, now looks like the 2nd worst. Some of these results are intuitive (the Oregon game and the 1st Villanova game were obvious stinkers), but some of this is surprising (e.g. Ball St. and Navy).

The best game was the St. John's game (30-4, 41-9 point run), along with Vanderbilt and Michigan. In fact, since Big East play began the Hoyas are an average of 3.9 points better than the spread. And remember that my calcs are based on statistics compiled through Monday, Feb 19th. This may be pointing to a lag in Pomeroy's adjusted statistics, in that they are weighted a bit too heavily by games early in the year.

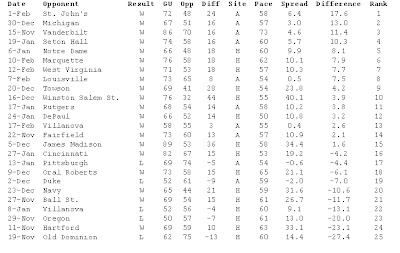
Here's a table of games to date, ranked from best to worst according to my fancy method:


Before I wrap this up, I'll point out a couple of things from the table:
  • Only 1 game in February (@ Nova) isn't in the Top 10.
  • The 6 worst games were at home, the 4 best on the road. This may be a good omen for tournament season.
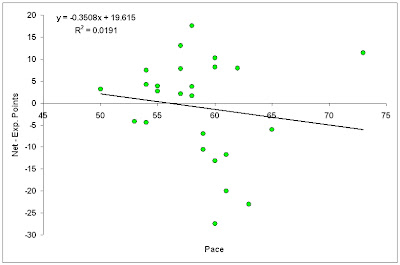
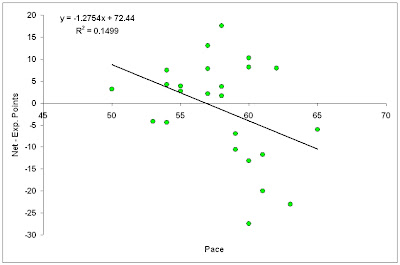
  • The 5 worst games all had paces of 60+. Is this a trend? Well that depends.
With Vandy Game


Without Vandy Game

Monday, February 19, 2007

News: Big East Scores - 2/19

Pitt 71, SHU 68
Looking at the play-by-play, the game wasn't as close as it appears. Pitt played without Aaron Gray (resting a sore ankle), and did enough to win a road Big East game. Don't think there's much to take from this one with regards to the upcoming game on Saturday.

Marq 80, Nova 67
Villanova looked like a world-beater against Georgetown, but it turns out Marquette was able to right the ship in time. To me, the key stat was rebounding - Villanova should have controlled the boards, but the Golden Eagles / Warriors won 30-26.
BIG win for Marquette, with their last 2 at Notre Dame and hosting Pitt; one more win against either of those teams or in the BET will absolutely lock a NCAA tourney bid - they likely nailed the lock tonight.
Best-case scenario for Villanova right now is to win out and get to 9-7 in the Big East, get a favorable seeding the BET (read: land on G'town side of the draw) and win a couple there. Hard to see them missing the NCAA's even at 8-8 (RPI=18 after Marquette game).

Analysis: Has the offense or defense improved?

A question that has come up a lot recently on HoyaTalk is whether the team defense has improved over the course of the season.

We can use the Game Plan data to take a look (click on image to enlarge):

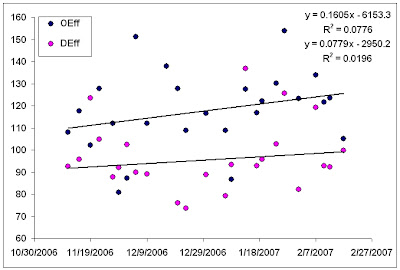
This plot shows the raw offensive and defensive efficiencies for each game played so far. From the plot, it looks like there has been an improvement in offense over the course of the season (multiply the slope by 30 days (~month) and you get ~5 ticks more efficient / month). Defensive efficiency, unfortunately, is also rising, albeit at a slower rate (~2.3 ticks / month), which would mean the defense is actually getting worse. Since G'town averages about 60 possessions / game, a "tick" ( = 1 point / 100 possessions) represents about 0.6 points, so Pomeroy suggests that the offense is improving about 3 pts. month, but the defense is giving back about 1.4 pts month.

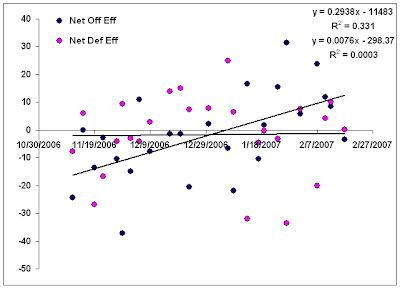
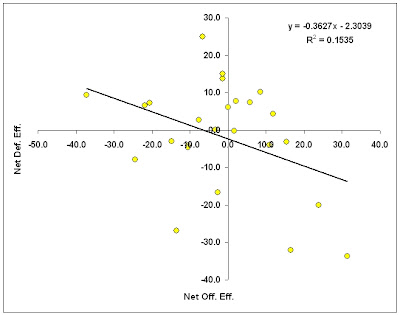
However, these numbers don't take into account the quality of opponent. We can do that by multiplying G'town's Off. Eff. by the opponents Adj. Def. Eff., then dividing by the season average (101.7 on Feb. 19th), to produce a net offensive efficiency. This represents how well the Hoyas' offense performed, accounting for the average defensive effort of the opponent. The same can be done for G'town's defensive efficiency (note here that I've flipped the sign for Net Def. Eff., so that a positive number mean G'town played better defense than average against their opponent). Here we go:

Well, things look a bit different now. The offense, accounting for the better defensive teams played lately, is actually getting much better as the season goes on (~5.3 pts / month), while the defense is actually stagnant (0.1 pts / month). What else is obvious is that there are 3 games since Jan 1st where the defense has been lousy [@ Pitt - L (1/13), Cinci - W (1/27) and @ L'ville - W (2/7)], but for all other games since early December, the Hoyas have defended about as well as or better than average.

Now there's a lot more you can do with these stats. For instance, do Net Off. Eff. and Net Def. Eff. track? This could indicate either playing to the level of your opponent, or my pet theory, the influence of the refs on the game:

And there does seem to be a trend, although not as significant as expected. When the Hoyas play lousy on defense, they play better on offense, and vice versa. Hard to say if this is just the result of how tightly the game is called, or another factor. I'll need to look at this more closely down the road.

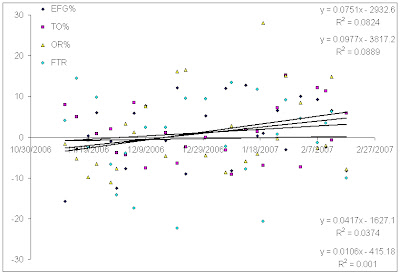
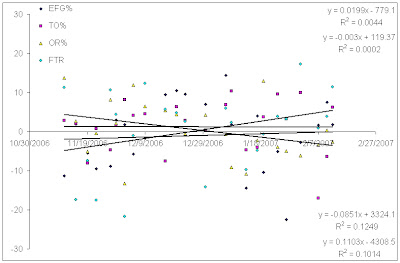
We can also break out offensive and defensive efficiencies into their constituents, and look for trends. Here, I'm using the same technique, comparing how well G'town performed in each of the four factors against the average performance of their opponent.

Offensive Efficiency Components

Defensive Efficiency Components

For these charts, the correlations on the left are eFG%, TO% on the top, OR%, FTR on the bottom. Now admittedly, these are a bit of a mess (as always, click on image to enlarge), but from the top chart, you can see that 3 of the four factors are improving; only free throw rate (the number of FTs per possession) has remained flat.

Defense is much more interesting. The most important factors, eFG% and turnovers created, have remained flat, but Georgetown seems to be giving up more offensive rebounds while fouling less. Not sure what to make of it; perhaps the team is playing more zone defense, which is reducing fouls at the expense of rebound position, but that is just conjecture.

Sunday, February 18, 2007

Analysis: Using KenPom.com's Game Plan page

When you look at the Game Plan page for Georgetown, below the table for individual game performance is a list of correlation coefficients for offensive and defensive efficiency versus various statistics, such as pace, effective field goal percentage, turnover percentage, etc.

Here's the correlation table, as of Feb 18, 2007:

                       Correlations
to OE to DE
Pace: -0.41 -0.20

eFG%: +0.72* -0.09
OR%: +0.35 -0.22
TO%: -0.60* -0.44
FTR: +0.13 -0.09

Opp eFG%: +0.20 +0.77*
Opp OR%: -0.26 +0.57*
Opp TO%: -0.17 -0.39
Opp FTR: -0.32 +0.29

Bold values are significant with a 95% confidence
Bold* values are significant with a 99% confidence

For Georgetown, Off. Eff. is well correlated with Eff. FG%, TO %, and pace, in that order. Def. Eff. is well correlated with Opp. Eff. FG%, Opp. Off. Reb. % and TO%, in that order.

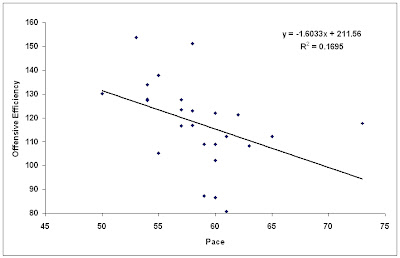
Let's look at one of these correlations in more detail (click on image to enlarge).


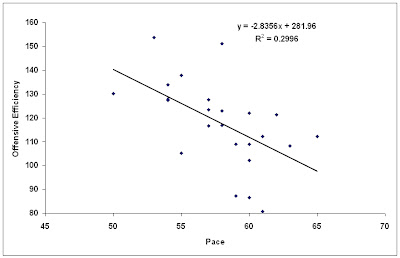
Here's a plot of Off. Eff. vs. Pace for Georgetown for the season so far. You'll note that the R^2 value in the plot is equal to the square of the correlation in Ken's table (-0.41 x -0.41 = 0.168). You'll also notice that there is a pace outlier for the dataset, namely the Vanderbilt game, with 73 possessions. For the season as a whole, Hoya games average 58.5 possessions, with a standard deviation of 4.6 [58.5 ± 4.6]. At ~95% CI (2 st. dev's.), the range is 49.4 - 67.7 possessions, so only the Vanderbilt game stands as an outlier.

If we remove it from the data set and re-run the numbers, the new plot looks like:


Well, a couple of things jump out here. The correlation is much stronger (r = -0.547), and the slope of the line is much steeper (pace has a larger effect). If you remove the Vanderbilt game from the data set and re-run Pomeroy's entire table, you'll find that the OE vs. pace correlation is the only one that shows a significant change (i.e. other than pace, the game was typical for Georgetown):
                        Correlations
to OE to DE
Pace: -0.55 -0.27

eFG%: +0.72* -0.09
OR%: +0.36 -0.22
TO%: -0.61* -0.44
FTR: +0.13 -0.10

Opp eFG%: +0.20 +0.77*
Opp OR%: -0.26 +0.58*
Opp TO%: -0.17 -0.39
Opp FTR: -0.34 +0.30

Bold values are significant with a 95% confidence
Bold* values are significant with a 99% confidence


Well, this is all fine and good, but I'd like to take the analysis of pace effects a bit further, hopefully later this week.

Extra: Sapp's Long Three

Here's Jessie Sapp's 55 (60?) foot three-pointer to end the 1st half against Villanova on Sunday (higher res. version here).


This shot turned out to be the margin of victory.

Introduction

I thought I'd present some data analysis for feedback.

I don't claim to be any sort of authority on basketball or statistical analysis, just a Georgetown fan with too much time on his hands.

The basic premise here is that information can be gleaned about team performance from the pace-independent statistics, such as those generated by Ken Pomeroy. To start things off, I'll look at the individual game stats found on his Game Plan page, I'm hoping to identify trends and relationships beyond the basic correlations between certain variables and offensive or defensive efficiency.

Ken Pomeroy attempts to account for level of competition with his "adjusted" statistics, which are available for pace, offensive efficiency and defensive efficiency. The underlying statistics for efficiency calcs are only available as raw. My analysis looks at both sets, so I will try to note whether I'm using adjusted or raw statistics, or a mixture of both.

Saturday, February 17, 2007

Final score: Georgetown 58, Villanova 55

  Georgetown vs Villanova  
02/17/07 Noon at Wachovia Center (Philadelphia, Pa.)
Final score: Georgetown 58, Villanova 55

Georgetown Min +/- Pts 2PM-A 3PM-A FTM-A FGA A Stl TO Blk OR DR PF
Summers, DaJuan 34:51 + 8 11/53 2 -5 0 -4 7 -8 9 /43 2 /17 0 /52 2 /53 4 /31 3 /28 3 /34 2
Green, Jeff 39:34 + 5 19/58 7 -14 1 -2 2 -3 16/47 4 /13 1 /57 2 /58 8 /35 2 /30 7 /36 2
Hibbert, Roy 18:07 + 6 4 /28 2 -4 0 -0 0 -0 4 /23 0 /8 1 /24 1 /26 2 /18 1 /15 2 /20 4
Wallace, Jonathan 34:46 - 4 2 /49 1 -4 0 -1 0 -0 5 /42 5 /17 0 /49 2 /49 0 /32 0 /27 1 /31 1
Sapp, Jessie 40:00 + 3 16/58 3 -6 3 -4 1 -2 10/47 3 /15 0 /58 2 /59 0 /35 0 /30 5 /36 1
Macklin, Vernon 08:20 - 8 0 /7 0 -0 0 -0 0 -0 0 /8 0 /3 0 /12 1 /12 0 /6 0 /5 1 /6 1
Rivers, Jeremiah 05:14 + 7 0 /9 0 -0 0 -0 0 -0 0 /5 0 /3 0 /9 0 /10 0 /3 0 /3 1 /5 1
Ewing, Patrick 19:08 - 2 6 /28 1 -1 1 -2 1 -2 3 /20 1 /8 0 /29 1 /28 0 /15 1 /12 1 /12 1
TOTALS 40:00 58 16-34 5 -13 11-15 47 15/21 2 /58 13/59 14/35 8 /30 23/36 13
0.471 0.385 0.733 0.714 0.034 0.220 0.400 0.267 0.639

Villanova Min +/- Pts 2PM-A 3PM-A FTM-A FGA A Stl TO Blk OR DR PF
CLARK, Shane 35:38 + 0 6 /52 0 -4 2 -3 0 -0 7 /49 1 /16 0 /50 1 /51 0 /31 1 /32 2 /26 4
SUMPTER, Curtis 34:13 + 3 15/50 3 -6 1 -5 6 -6 11/46 1 /13 0 /50 4 /50 2 /31 2 /29 6 /29 4
SHERIDAN, Will 28:08 + 0 5 /42 2 -8 0 -0 1 -2 8 /34 2 /12 1 /39 0 /37 2 /24 3 /22 3 /17 1
REYNOLDS, Scottie 28:16 - 2 18/42 3 -8 4 -6 0 -0 14/45 4 /8 2 /45 1 /46 0 /25 1 /31 3 /21 4
NARDI, Mike 33:25 - 6 2 /44 1 -4 0 -2 0 -0 6 /44 2 /14 0 /48 2 /47 1 /29 0 /31 1 /25 0
REDDING, Reggie 16:23 - 1 6 /20 1 -1 0 -1 4 -6 2 /16 0 /4 2 /25 0 /24 0 /10 0 /13 2 /12 2
CUNNINGHAM, Dante 23:57 - 9 3 /25 1 -4 0 -0 1 -2 4 /26 1 /5 1 /38 1 /35 0 /20 3 /22 2 /20 3
TOTALS 40:00 55 11-35 7 -17 12-16 52 11/18 6 /59 10/58 5 /34 13/36 22/30 18
0.314 0.412 0.750 0.611 0.102 0.172 0.147 0.361 0.733

Efficiency: Georgetown 0.983, Villanova 0.948
eFG%: Georgetown 0.500, Villanova 0.413
Substitutions: Georgetown 34, Villanova 34

2-pt Shot Selection:
Dunks: Georgetown 5-5, Villanova 0-0
Layups/Tips: Georgetown 5-14, Villanova 5-13
Jumpers: Georgetown 6-15, Villanova 6-22

Monday, February 12, 2007

Final score: Georgetown 71, West Virginia 53

  West Virginia vs Georgetown  
02/12/07 8 p.m. at Verizon Center, Washington, D.C.
Final score: Georgetown 71, West Virginia 53

West Virginia Min +/- Pts 2PM-A 3PM-A FTM-A FGA A Stl TO Blk OR DR PF
ALEXANDER, Joe 25:47 - 3 10/38 2 -3 2 -5 0 -0 8 /36 0 /11 0 /36 1 /38 2 /21 2 /21 2 /16 3
NICHOLS, Darris 31:36 - 26 10/35 3 -4 1 -2 1 -2 6 /42 2 /10 0 /46 1 /47 0 /25 1 /29 0 /15 0
YOUNG, Frank 29:21 - 29 8 /29 1 -3 2 -9 0 -0 12/36 3 /8 4 /45 4 /46 0 /22 1 /26 1 /12 3
RUOFF, Alex 33:12 - 30 7 /37 2 -4 1 -4 0 -0 8 /44 1 /12 3 /49 5 /49 0 /27 0 /30 1 /15 5
SUMMERS, Rob 17:38 - 14 2 /23 1 -2 0 -0 0 -0 2 /25 1 /9 0 /24 0 /24 0 /15 2 /15 0 /7 4
BUTLER, Da'Sean 20:56 - 13 5 /28 1 -6 1 -2 0 -0 8 /27 3 /10 2 /28 2 /29 0 /19 1 /15 1 /11 4
MAZZULLA, Joe 08:24 + 8 0 /18 0 -1 0 -0 0 -0 1 /10 3 /6 0 /12 0 /12 0 /7 0 /4 0 /6 0
TALKINGTON, Ted 03:37 + 9 3 /11 0 -0 1 -1 0 -0 1 /4 0 /2 0 /6 0 /6 0 /3 0 /1 0 /4 0
SMITH, Wellington 12:56 + 4 0 /20 0 -2 0 -1 0 -0 3 /17 0 /6 0 /20 0 /20 1 /9 0 /12 1 /9 0
SMALLIGAN, Jamie 16:33 + 4 8 /26 1 -1 1 -2 3 -4 3 /19 0 /6 0 /24 0 /24 0 /12 2 /12 2 /10 0
TOTALS 40:00 53 11-26 9 -26 4 -6 52 13/20 9 /58 15/59 3 /32 10/33 9 /21 19
0.423 0.346 0.667 0.650 0.155 0.254 0.094 0.303 0.429

Georgetown Min +/- Pts 2PM-A 3PM-A FTM-A FGA A Stl TO Blk OR DR PF
Wallace, Jonathan 25:56 + 27 14/52 3 -5 2 -2 2 -2 7 /29 3 /12 2 /38 2 /38 0 /17 2 /13 3 /26 2
Summers, DaJuan 29:07 + 28 10/59 2 -2 2 -3 0 -0 5 /33 1 /17 0 /44 4 /44 0 /19 2 /14 3 /26 1
Sapp, Jessie 35:20 + 19 4 /63 2 -5 0 -0 0 -0 5 /40 4 /22 1 /51 4 /49 0 /24 0 /18 2 /28 1
Green, Jeff 31:01 + 28 15/60 6 -7 1 -6 0 -1 13/34 5 /15 1 /45 2 /46 1 /22 1 /13 5 /29 0
Hibbert, Roy 22:27 + 32 20/52 4 -5 0 -0 12-13 5 /27 0 /13 0 /33 2 /35 1 /15 3 /11 3 /19 3
Macklin, Vernon 17:33 - 14 4 /19 2 -3 0 -0 0 -0 3 /18 2 /7 0 /26 0 /23 0 /11 2 /10 1 /14 2
Izzo, Kenny 00:58 - 6 0 /0 0 -0 0 -0 0 -0 0 /1 0 /0 0 /2 0 /1 0 /0 0 /1 0 /0 0
Rivers, Jeremiah 15:21 + 3 0 /25 0 -1 0 -0 0 -0 1 /17 2 /10 0 /23 1 /24 0 /10 1 /8 4 /11 1
Crawford, Tyler 06:41 - 10 0 /6 0 -0 0 -1 0 -0 1 /8 0 /2 0 /10 1 /9 0 /3 0 /6 1 /3 0
SPANN, Octavius 02:25 - 7 0 /2 0 -1 0 -1 0 -0 2 /3 0 /1 0 /4 0 /4 0 /1 0 /2 0 /1 0
Ewing, Patrick 12:13 - 4 4 /17 2 -3 0 -0 0 -1 3 /14 1 /5 0 /17 0 /16 0 /8 0 /8 0 /8 1
Dizdarevic, Sead 00:58 - 6 0 /0 0 -0 0 -0 0 -0 0 /1 0 /0 0 /2 0 /1 0 /0 0 /1 0 /0 0
TOTALS 40:00 71 21-32 5 -13 14-17 45 18/26 4 /59 17/58 2 /26 12/21 23/33 11
0.656 0.385 0.824 0.692 0.068 0.293 0.077 0.571 0.697

Efficiency: Georgetown 1.224, West Virginia 0.898
eFG%: Georgetown 0.633, West Virginia 0.471
Substitutions: Georgetown 21, West Virginia 28

2-pt Shot Selection:
Dunks: Georgetown 3-3, West Virginia 3-3
Layups/Tips: Georgetown 13-17, West Virginia 7-14
Jumpers: Georgetown 5-12, West Virginia 1-9

Saturday, February 10, 2007

Final score: Georgetown 76, Marquette 58

  Marquette vs Georgetown  
02/10/07 noon at Verizon Center, Washington, D.C.
Final score: Georgetown 76, Marquette 58

Marquette Min +/- Pts 2PM-A 3PM-A FTM-A FGA A Stl TO Blk OR DR PF
JAMES, Dominic 33:41 - 18 6 /47 2 -11 0 -6 2 -2 17/53 3 /15 0 /55 2 /55 0 /35 0 /36 4 /28 1
MCNEAL, Jerel 25:47 - 19 11/36 4 -8 1 -5 0 -0 13/39 1 /9 1 /41 3 /41 0 /23 1 /25 2 /17 5
MATTHEWS, Wesley 19:15 - 2 2 /26 1 -2 0 -1 0 -0 3 /29 1 /10 0 /29 2 /29 0 /19 0 /18 2 /21 2
HAYWARD, Lazar 17:20 - 13 14/24 3 -6 1 -1 5 -5 7 /33 0 /3 0 /32 0 /31 0 /17 3 /26 1 /13 1
BARRO, Ousmane 30:10 - 11 14/49 5 -8 0 -0 4 -4 8 /50 2 /13 2 /50 1 /50 1 /30 7 /32 5 /24 5
FITZGERALD, Dan 27:01 - 11 7 /38 2 -2 1 -2 0 -0 4 /38 1 /10 0 /41 1 /42 1 /30 1 /25 2 /24 2
CUBILLAN, David 26:30 - 10 3 /40 0 -2 1 -6 0 -0 8 /40 1 /13 0 /40 0 /41 0 /26 0 /26 2 /22 1
BURKE, Dwight 07:58 - 1 1 /16 0 -1 0 -0 1 -2 1 /13 0 /5 0 /11 0 /12 0 /4 2 /8 0 /5 0
BLACKLEDGE, Lawrence 03:51 + 0 0 /7 0 -0 0 -0 0 -0 0 /6 0 /3 0 /5 0 /4 0 /3 0 /3 0 /2 1
KINSELLA, Mike 08:27 - 5 0 /7 0 -1 0 -0 0 -0 1 /9 0 /3 0 /11 0 /10 1 /8 0 /6 2 /9 3
TOTALS 40:00 58 17-41 4 -21 12-13 62 9 /21 3 /63 10/63 3 /39 15/41 20/33 21
0.415 0.190 0.923 0.429 0.048 0.159 0.077 0.366 0.606

Georgetown Min +/- Pts 2PM-A 3PM-A FTM-A FGA A Stl TO Blk OR DR PF
Wallace, Jonathan 35:30 + 22 10/71 2 -5 1 -4 3 -4 9 /46 6 /22 1 /58 1 /57 0 /36 1 /25 5 /38 2
Summers, DaJuan 32:49 + 20 10/62 2 -4 2 -3 0 -1 7 /42 2 /16 0 /53 1 /52 1 /33 1 /26 4 /36 3
Sapp, Jessie 31:41 + 15 9 /63 2 -3 1 -3 2 -2 6 /41 2 /18 1 /49 2 /51 0 /34 0 /22 3 /35 3
Green, Jeff 37:57 + 20 24/76 7 -11 2 -4 4 -5 15/54 4 /17 0 /60 1 /61 1 /40 2 /32 3 /39 1
Hibbert, Roy 35:01 + 25 23/71 7 -12 0 -0 9 -11 12/45 0 /17 1 /55 4 /55 3 /33 4 /25 7 /37 3
Macklin, Vernon 04:59 - 7 0 /5 0 -1 0 -0 0 -0 1 /10 0 /2 0 /8 0 /8 0 /8 1 /8 0 /4 0
Rivers, Jeremiah 08:26 - 4 0 /7 0 -2 0 -0 0 -0 2 /16 0 /3 0 /13 0 /13 0 /9 0 /15 1 /7 0
Crawford, Tyler 04:23 + 3 0 /11 0 -0 0 -1 0 -0 1 /7 0 /3 0 /6 0 /5 0 /3 1 /4 0 /2 1
Ewing, Patrick 09:18 - 4 0 /14 0 -1 0 -1 0 -0 2 /14 1 /6 0 /13 1 /13 1 /9 2 /8 1 /7 0
TOTALS 40:00 76 20-39 6 -16 18-23 55 15/26 3 /63 10/63 6 /41 13/33 26/41 13
0.513 0.375 0.783 0.577 0.048 0.159 0.146 0.394 0.634

Efficiency: Georgetown 1.206, Marquette 0.921
eFG%: Georgetown 0.527, Marquette 0.371
Substitutions: Georgetown 17, Marquette 29

2-pt Shot Selection:
Dunks: Georgetown 3-3, Marquette 2-2
Layups/Tips: Georgetown 9-18, Marquette 9-23
Jumpers: Georgetown 8-18, Marquette 6-16

Wednesday, February 7, 2007

Final score: Georgetown 73, Louisville 65

  GEORGETOWN vs LOUISVILLE  
2/7/07 7:02PM at FREEDOM HALL, LOUISVILLE, KY
Final score: GEORGETOWN 73, LOUISVILLE 65

GEORGETOWN Min +/- Pts 2PM-A 3PM-A FTM-A FGA A Stl TO Blk OR DR PF
Summers, DaJuan 34:11 + 14 13/61 2 -6 2 -3 3 -4 9 /38 4 /17 1 /47 0 /47 1 /29 1 /20 5 /41 3
Green, Jeff 38:43 + 9 16/71 6 -8 1 -2 1 -3 10/46 4 /19 0 /54 2 /53 1 /31 1 /23 6 /42 1
Hibbert, Roy 35:46 + 9 20/64 9 -10 0 -0 2 -2 10/40 1 /14 0 /49 1 /48 1 /29 3 /19 8 /42 4
Wallace, Jonathan 30:14 + 13 7 /60 0 -1 1 -3 4 -4 4 /35 3 /20 0 /40 2 /42 0 /19 1 /16 1 /31 4
Sapp, Jessie 36:23 + 9 11/68 0 -4 2 -5 5 -6 9 /42 5 /22 0 /51 0 /51 1 /30 0 /21 4 /41 0
Macklin, Vernon 02:31 + 2 0 /6 0 -0 0 -0 0 -0 0 /4 0 /2 0 /2 0 /3 0 /1 0 /2 0 /0 1
Rivers, Jeremiah 13:23 - 6 0 /18 0 -1 0 -0 0 -0 1 /15 1 /7 0 /19 1 /17 0 /15 0 /9 0 /14 1
Ewing, Patrick 08:49 - 10 6 /17 3 -3 0 -0 0 -2 3 /10 1 /3 0 /13 1 /14 0 /6 1 /5 0 /4 5
TOTALS 40:00 73 20-33 6 -13 15-21 46 19/26 1 /55 7 /55 4 /32 9 /23 26/42 19
0.606 0.462 0.714 0.731 0.018 0.127 0.125 0.391 0.619

LOUISVILLE Min +/- Pts 2PM-A 3PM-A FTM-A FGA A Stl TO Blk OR DR PF
WILLIAMS, Terrence 37:54 - 8 8 /54 1 -8 2 -9 0 -0 17/53 3 /13 2 /50 0 /50 0 /33 2 /40 1 /23 1
PALACIOS, Juan 11:11 - 12 3 /7 0 -3 1 -3 0 -0 6 /15 0 /1 0 /15 0 /15 0 /10 0 /13 1 /8 1
PADGETT, David 36:36 - 12 8 /53 1 -6 0 -0 6 -6 6 /54 2 /15 0 /51 0 /50 1 /28 6 /41 3 /22 3
JENKINS, Brandon 15:22 - 13 3 /14 0 -1 0 -1 3 -4 2 /25 0 /5 0 /19 0 /19 0 /17 2 /21 1 /8 0
McGEE, Andre 10:49 - 9 3 /8 0 -1 1 -3 0 -0 4 /19 0 /2 1 /14 0 /14 0 /9 0 /16 2 /5 0
CLARK, Earl 29:48 + 1 14/58 5 -9 1 -1 1 -5 10/46 2 /12 0 /41 0 /41 2 /23 2 /31 3 /15 3
SOSA, Edgar 26:37 + 3 11/55 2 -3 1 -4 4 -6 7 /37 3 /13 0 /39 1 /38 0 /21 1 /24 1 /17 4
SCOTT, Will 11:44 + 0 6 /25 0 -0 2 -3 0 -0 3 /18 1 /6 0 /19 0 /18 0 /5 0 /11 0 /5 3
HUFFMAN, Jonathan 03:24 + 4 0 /12 0 -1 0 -0 0 -0 1 /6 1 /4 0 /4 0 /5 0 /5 0 /2 0 /1 0
SMITH, Jerry 16:35 + 6 9 /39 0 -0 3 -4 0 -0 4 /27 2 /9 0 /23 0 /25 0 /14 1 /16 0 /11 1
TOTALS 40:00 65 9 -32 11-28 14-21 60 14/20 3 /55 1 /55 3 /33 16/42 14/23 16
0.281 0.393 0.667 0.700 0.055 0.018 0.091 0.381 0.609

Efficiency: GEORGETOWN 1.327, LOUISVILLE 1.182
eFG%: GEORGETOWN 0.630, LOUISVILLE 0.425
Substitutions: GEORGETOWN 20, LOUISVILLE 20

2-pt Shot Selection:
Dunks: GEORGETOWN 6-6, LOUISVILLE 1-1
Layups/Tips: GEORGETOWN 6-7, LOUISVILLE 4-8
Jumpers: GEORGETOWN 8-20, LOUISVILLE 4-23