Saturday, February 28, 2009

Recap: Georgetown 56, Villanova 54

Just a numbers dump for now - hopefully some text added later tonight.


Let's run the numbers:
TEMPO-FREE BOX SCORE

. Visitor Home
. GU Villanova
. 1st Half 2nd Half Total 1st Half 2nd Half Total
Pace 33 31 65

Effic. 94.2 76.0 85.5 79.5 85.5 82.4

eFG% 58.0 47.5 53.3 29.2 45.2 36.7
TO% 35.3 41.2 38.1 29.4 31.7 30.5
OR% 33.3 38.5 36.0 47.4 28.6 39.4
FT Rate 16.0 30.0 22.2 66.7 52.4 60.0

Assist Rate 57.1 87.5 68.2 57.1 62.5 60.0
Block Rate 22.2 18.2 20.7 0.0 25.0 10.3
Steal Rate 8.8 15.8 12.2 23.5 12.7 18.3

2FG% 76.5 41.7 62.1 38.9 45.5 41.4
3FG% 12.5 37.5 25.0 0.0 30.0 18.8
FT% 75.0 83.3 80.0 81.2 72.7 77.8


GU                    Off    Poss           Individ     Def             Individ                
Player Poss Used ORtg Pts Prod Poss DRtg Pts Allow Net Pts
Summers, DaJuan 49 15.1 71.5 10.8 47 95.8 9.0 +1.8
Mescheriakov, Nikita 34 6.0 180.2 10.8 34 84.9 5.8 +5.0
Monroe, Greg 52 6.7 113.3 7.6 52 82.3 8.6 -0.9
Wright, Chris 59 16.2 85.4 13.8 58 72.0 8.3 +5.5
Freeman, Austin 27 4.0 51.1 2.0 25 80.3 4.0 -2.0
Clark, Jason 43 6.2 107.6 6.6 44 84.7 7.5 -0.8
Sapp, Jessie 25 5.8 26.2 1.5 27 53.3 2.9 -1.4
Vaughn, Julian 16 1.2 41.2 0.5 16 65.6 2.1 -1.6
Sims, Henry 25 3.3 17.7 0.6 27 78.5 4.2 -3.7
TOTALS 66 64.4 84.3 54.3 66 79.4 52.4 +1.9

Villanova Off Poss Individ Def Individ
Player Poss Used ORtg Pts Prod Poss DRtg Pts Allow Net Pts
CLARK, Shane 29 1.6 93.3 1.5 31 83.5 5.2 -3.7
CUNNINGHAM, Dante 62 12.0 103.1 12.4 61 84.4 10.3 +2.1
REYNOLDS, Scottie 57 18.5 65.8 12.2 58 77.3 9.0 +3.2
REDDING, Reggie 57 9.0 93.3 8.4 57 79.8 9.1 -0.7
ANDERSON, Dwayne 45 9.7 80.8 7.9 46 71.9 6.6 +1.3
PENA, Antonio 3 1.0 0.0 0.0 2 50.0 0.2 -0.2
FISHER, Corey 40 8.6 55.0 4.8 37 91.7 6.8 -2.0
STOKES, Corey 37 6.4 96.0 6.1 38 75.5 5.7 +0.4
TOTALS 66 66.8 79.5 53.2 66 80.1 52.9 +0.3


HD BOX SCORE

GU vs Villanova
02/28/09 Noon at Wachovia Center (Philadelphia, Pa.)
Final score: GU 56, Villanova 54

GU Min +/- Pts 2PM-A 3PM-A FTM-A FGA A Stl TO Blk OR DR PF
Summers, DaJuan 28:26 + 2 16/45 2- 2 3- 6 3- 3 8/34 1/12 0/47 8/49 2/21 1/17 1/21 3
Mescheriakov, Nikita 21:44 + 5 11/37 3- 3 1- 2 2- 2 5/24 1/10 1/34 2/34 0/15 2/11 1/16 3
Monroe, Greg 31:16 - 2 8/44 4- 8 0- 0 0- 0 8/36 3/14 1/52 1/52 1/23 0/19 4/24 3
Wright, Chris 36:18 +10 13/54 5- 7 0- 3 3- 5 10/43 5/16 1/58 3/59 0/26 0/24 4/31 1
Freeman, Austin 16:10 + 0 2/20 1- 2 0- 1 0- 0 3/19 1/ 7 0/25 2/27 1/10 0/12 2/12 5
Clark, Jason 24:53 + 3 4/38 2- 3 0- 1 0- 0 4/28 3/14 0/44 2/43 0/19 3/13 1/21 2
Sapp, Jessie 16:21 - 5 2/14 1- 2 0- 1 0- 0 3/16 0/ 4 3/27 3/25 0/10 0/12 1/12 0
Vaughn, Julian 09:44 + 2 0/12 0- 2 0- 0 0- 0 2/10 0/ 4 1/16 1/16 1/ 8 1/ 7 0/12 0
Sims, Henry 15:08 - 5 0/16 0- 0 0- 2 0- 0 2/15 1/ 7 1/27 2/25 1/13 0/10 1/16 3
TOTALS 40:00 56 18-29 4-16 8-10 45 15/22 8/66 26/66 6/29 9/25 20/33 20
. 0.621 0.250 0.800 0.682 0.121 0.394 0.207 0.360 0.606

Villanova Min +/- Pts 2PM-A 3PM-A FTM-A FGA A Stl TO Blk OR DR PF
CLARK, Shane 19:34 - 3 2/25 1- 3 0- 1 0- 0 4/21 0/ 6 2/31 1/29 1/13 0/16 0/11 2
CUNNINGHAM, Dante 36:46 + 0 13/53 4- 7 0- 0 5- 6 7/41 0/11 1/61 2/62 2/27 4/29 5/24 2
REYNOLDS, Scottie 34:30 - 4 12/48 1- 4 1- 6 7- 9 10/37 4/11 4/58 6/57 0/26 0/27 1/23 2
REDDING, Reggie 34:29 + 7 8/51 3- 4 0- 0 2- 2 4/38 2/11 1/57 4/57 0/23 3/26 1/20 3
ANDERSON, Dwayne 29:49 - 4 7/35 2- 3 0- 2 3- 4 5/33 1/ 9 2/46 3/45 0/21 3/23 4/21 2
PENA, Antonio 01:48 + 0 0/ 1 0- 0 0- 0 0- 0 0/ 3 0/ 0 0/ 2 1/ 3 0/ 0 0/ 3 0/ 0 2
FISHER, Corey 21:28 + 0 6/32 1- 5 1- 3 1- 2 8/28 0/ 6 0/37 3/40 0/15 1/23 1/11 2
STOKES, Corey 21:36 - 6 6/25 0- 3 1- 4 3- 4 7/24 2/ 6 2/38 1/37 0/20 1/18 2/15 0
TOTALS 40:00 54 12-29 3-16 21-27 45 9/15 12/66 21/66 3/29 13/33 16/25 15
. 0.414 0.188 0.778 0.600 0.182 0.318 0.103 0.394 0.640

Efficiency: GU 0.848, Villanova 0.818
eFG%: GU 0.533, Villanova 0.367
Substitutions: GU 28, Villanova 36

2-pt Shot Selection:
Dunks: GU 0-0, Villanova 0-1
Layups/Tips: GU 12-19, Villanova 7-14
Jumpers: GU 6-10, Villanova 5-14

Fast break pts: GU 4 (0.083), Villanova 6 (0.182)
Seconds per off. poss: GU 20.1, Villanova 16.2

Friday, February 27, 2009

More on luck

I noticed a discussion of luck and consistency on HoyaTalk tonight, and that thread pointed to an article by John Gasaway on Basketball Prospectus.

Gasaway provides a list of top lucky and unlucky teams, based on winning percentage compared to net efficiency. This is something that I set up to track a while ago, but just have been too busy to get around to posting. Now that I've been scooped, I thought I'd just dump what I've got.

First, to define terms:
  • winning percentage is for conference play only, as are all following stats
  • net efficiency is simply the difference between offensive efficiency (points scored / 100 possessions) and defensive efficiency (points allowed / 100 possessions)
  • luck is the difference between actual winning percentage and expected winning percentage, based upon net efficiency
So how do we determine expected winning percentage? Well, there is a fairly strong correlation between net efficiency and actual winning percentage. Here are the actual winning percentage versus net efficiency numbers for the past five seasons (2005-2009) for the Big East:


I've colored the markers for this season (through 2/26) in blue, all previous seasons in red. The horizontal and vertical black lines represent the break-even points, either as net efficiency is zero or winning percentage is 50%.

The diagonal black line is the best linear fit to the data and the dashed blue lines are the 99% prediction bands - there is only a 1 in 100 chance that a team will lie outside of the prediction bands.

Teams that lay above and to the left of the fitted line are "lucky" in the sense that they have a better winning percentage than a team would expect to have based on net efficiency. And teams below and to the right of the fitted lines are unlucky.

The infamous 2006 Notre Dame team has been the unluckiest team in the five years I've run - they ended the year 6-11 (including a loss in the BET), but would have been expected to end up 10-7. Actually their expected won/loss record in the Big East was 9.7-7.3; I'm not a big fan of decimal wins and losses, but I'll use the extra significant digit to distinguish between teams (below).

That same year, the Syracuse Orangemen ran off four improbable wins in a row in the BET, which makes them the luckiest team in the last 5 years.

We can also glean a bit more from the graph:
  • While the conference is normally thought of as the Big 5 (UConn, Pitt, Louiville, Marquette and Villanova), the net efficiency rankings indicate that 'Nova may be just a bit behind those other four, and at about the same level as West Virginia.
  • It may not be apparant by winning percentage, but the efficiency stats indicate that there is a big jump between the top-12 teams in the conference and the bottom four (Rutgers, USF, St. John's, DePaul).
  • While there are some lucky and unlucky teams, this year there are not gross outliers either way - at least not yet.
  • It's always important to keep in mind that this analysis is for the conference season as a whole, and doesn't account well for injuries (D. James, J. Dyson, etc.).

Note: The actual method used by Ken Pomeroy (and probably John Gasaway) to calculate luck is based on Pythagorean winning percentage. The math is a bit more complicated, but the results are essentially the same as the graph presented above - the only big differences are for extremely good or bad teams, such as DePaul. For the table below, I'll use this more rigorous method.


Here's a table summarizing this year's teams, ranked by luck.
.                 Wins  Losses   Exp Win  Exp Loss   Luck
Cincinnati 8 7 5.6 9.4 2.4
Providence 9 7 7.1 8.9 1.9
St. John's 4 11 2.3 12.7 1.7
Villanova 11 4 10.4 4.6 0.6
South Florida 3 12 2.4 12.6 0.6
Louisville 13 2 12.7 2.3 0.3
Marquette 12 3 11.7 3.3 0.3
Seton Hall 6 9 5.7 9.3 0.3
Connecticut 14 2 14.1 1.9 -0.1
Pittsburgh 12 3 12.6 2.4 -0.6
Notre Dame 7 8 7.7 7.3 -0.7
DePaul 0 15 0.9 14.1 -0.9
Syracuse 8 7 9.1 5.9 -1.1
Georgetown 5 10 6.4 8.6 -1.4
Rutgers 1 14 2.5 12.5 -1.5
West Virginia 8 7 10.4 4.6 -2.4

As Gasaway says, Cincinnati, Providence and St. John's are the luckiest teams so far this season in the Big East, and Georgetown and West Virginia are amongst the unluckiest (for some reason, he left out Rutgers).

Wednesday, February 25, 2009

Updated conference stats, by half

If there's one thing you can count on around here, it's that we'll pander to special requests.

With prodding from a poster over at HoyaTalk, here's an updated tempo-free box score for conference games only, broken out by half:


. Offense Defense
. 1st Half 2nd Half Total 1st Half 2nd Half Total

Record 5-10
Pace 31.6 33.3 64.9

Eff. 103.9 104.1 104.1 98.6 114.2 106.8
Eff. Margin 5.3 -10.1 -2.7

eFG% 53.2 50.2 51.7 50.0 53.5 51.8
TO% 23.0 20.5 21.7 23.0 17.6 20.2
OR% 36.7 34.1 35.4 33.8 40.5 37.2
FTA/FGA 24.1 45.8 35.0 24.8 51.0 38.2
FTM/FGA 15.9 32.7 24.3 17.0 34.2 25.8

Assist Rate 56.7 59.0 57.8 53.7 61.7 58.0
Block Rate 13.3 9.7 11.4 8.0 7.3 7.6
Steal Rate 10.8 9.9 10.3 12.7 10.1 11.3

2FG% 50.4 53.2 51.8 47.7 54.5 51.3
3FG% 39.1 29.6 34.4 36.3 34.1 35.2
FT% 66.0 71.4 69.5 68.7 67.1 67.6

Monday, February 23, 2009

Recap: Louisville 76, Georgetown 58

Well, this isn't much fun anymore. If you're looking for a meltdown, head on over to HoyaTalk.

I don't have too much to say about tonight's game, other than it was - statistically - the worst game of the year for the Hoyas. Worse than the Pitt game, where DeJuan Blair did whatever he wanted; worse than the Tennessee game, where Cameron Tatum likely had the game of his life, all in the last 6:00; and even worse than the West Virginia game, where the Mountaineers made sure to squeeze out the largest margin of victory possible.

Now a large reason for this being the worst game of the season is that Louisville was completely unconscious from deep, making 8 of their first 10 3FGA. That's gonna tend to skew Georgetown's defensive numbers. But the Hoyas also played poor offensively, even accounting for the customarily stellar Louisville defense.


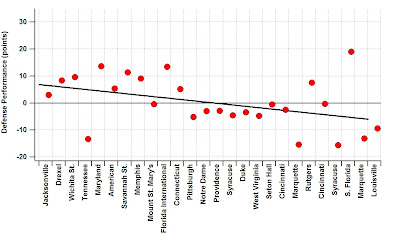
All of this comes from the Performance Charts I update weekly (and now updated through tonight's game). If you have a look at the overall performance for the Hoyas this season (reproduced here), its clear that a sea change took place between the UConn and Pitt games.


After the UConn game, KenPom.com rated Georgetown the best team in the country. The Hoyas have been sliding down the ratings / rankings ever since, but that early season run is still skewing the overall computer numbers for the season, along with the expectations for Hoya fans going into each game.

If I look only at the 15 games played in 2009 (Pittsburgh forward), I can recalculate G'town's Pythagorean rating (per KenPom): Georgetown would rank 65th (with a rating = 0.814), just behind Siena (and 2 places ahead of Maryland), well off the NCAA bubble.


There's no cut-and-dry explanation for the free-fall - the defense has been mostly poor since the UConn game, with Georgetown defending better than expected only in the Rutgers and S. Florida games. But, if you'll forgive a fitted line, it looks like the defense has actually been trending worse all season:


For an eight game stretch between the Pitt and first Cincinnati games, the D was mediocre but never horrible. Since, there have been two strong performances (the aforementioned Rutgers and USF games), an average game (2nd game vs. Cinci) and four lousy efforts, including three of the last four. I don't see any common thread to account for the results from game-to-game, but would be happy to hear any suggestions. Pomeroy's analysis suggests all four factors contribute.


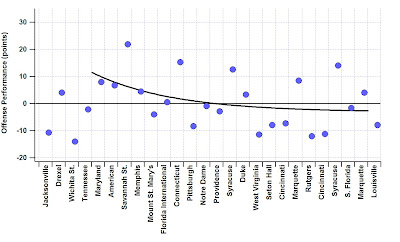
Offense, to me, is only slightly less troubling. Here, to my eye, there is a distinct declining trend since either the Maryland romp or soon afterward:


It looks like the offense declined strongly in December and January, and has now plateaued. For the middle part of the season, the offense was the great-unknown from game-to-game, leading to the blow-out win against Syracuse and the blow-out loss against West Virginia. Unfortunately, the defense has recently become even more unpredictable, making each game a crapshoot at best.


If you combine the two fitted lines and apply them to overall performance for this season since the Maryland game, you get this:


Not a pretty picture. If it's any consolation, it appears that the Hoyas may have finally hit bottom. We can only hope.


Well, that's all for tonight. I'll update the stats pages tomorrow.

As for tonight, let's run the numbers:

TEMPO-FREE BOX SCORE

. Home Visitor
. GU Louisville
. 1st Half 2nd Half Total 1st Half 2nd Half Total
Pace 33 34 67

Effic. 93.9 78.6 85.8 124.2 102.0 112.5

eFG% 57.9 32.8 42.2 85.0 45.8 63.6
TO% 27.3 17.5 22.2 27.3 20.4 23.7
OR% 15.4 37.5 29.7 28.6 35.3 33.3
FT Rate 78.9 25.0 45.1 55.0 87.5 72.7

Assist Rate 30.0 40.0 35.0 71.4 70.0 70.8
Block Rate 0.0 5.6 3.1 0.0 12.5 8.6
Steal Rate 21.2 11.7 16.3 18.2 11.7 14.8

2FG% 72.7 37.5 48.6 57.1 44.4 50.0
3FG% 25.0 12.5 18.8 100.0 33.3 66.7
FT% 60.0 75.0 65.2 63.6 61.9 62.5


INDIVIDUAL NET POINTS STATS

GU Off Poss Individ Def Individ
Player Poss Used ORtg Pts Prod Poss DRtg Pts Allow Net Pts
Summers, DaJuan 49 6.5 53.5 3.5 50 113.2 11.3 -7.8
Wright, Chris 61 15.5 71.2 11.0 60 110.2 13.2 -2.2
Mescheriakov, Nikita 27 4.5 71.6 3.2 27 118.9 6.4 -3.2
Monroe, Greg 51 10.7 89.0 9.5 50 95.3 9.5 +0.0
Freeman, Austin 46 5.4 126.1 6.8 47 107.6 10.1 -3.3
Clark, Jason 35 7.6 71.1 5.4 36 105.3 7.6 -2.2
Sapp, Jessie 40 9.1 100.4 9.2 40 87.5 7.0 +2.2
Vaughn, Julian 11 1.8 257.7 4.7 11 156.3 3.4 +1.3
Sims, Henry 6 0.5 200.0 1.0 6 132.2 1.6 -0.6
Wattad, Omar 9 1.0 0.0 0.0 8 76.8 1.2 -1.2
TOTALS 67 62.7 86.7 54.4 67 106.6 71.4 -17.1

Louisville Off Poss Individ Def Individ
Player Poss Used ORtg Pts Prod Poss DRtg Pts Allow Net Pts
WILLIAMS, Terrence 64 14.4 109.7 15.8 64 76.5 9.8 +6.0
CLARK, Earl 63 17.0 115.2 19.6 62 71.1 8.8 +10.8
SAMUELS, Samardo 42 10.1 106.9 10.8 41 84.8 7.0 +3.8
McGEE, Andre 38 0.8 253.4 2.1 38 70.5 5.4 -3.3
SMITH, Jerry 35 6.2 93.7 5.8 36 81.9 5.9 -0.1
KNOWLES, Preston 31 5.9 116.3 6.9 29 101.2 5.9 +1.0
SOSA, Edgar 29 4.2 109.2 4.6 29 101.3 5.9 -1.2
SCOTT, Will 4 0.0 - 0.0 5 136.0 1.4 -1.4
SWOPSHIRE, Jared 4 1.0 0.0 0.0 5 100.0 1.0 -1.0
GOODE, George 7 1.4 47.6 0.7 8 131.6 2.1 -1.4
JENNINGS, Terrence 18 5.0 141.5 7.0 18 69.6 2.5 +4.5
TOTALS 67 66.1 110.9 73.3 67 82.9 55.5 +17.8


HD BOX SCORE

Louisville vs GU
02/23/09 7:00 at Verizon Center
Final score: Louisville 76, GU 58

Louisville Min +/- Pts 2PM-A 3PM-A FTM-A FGA A Stl TO Blk OR DR PF
WILLIAMS, Terrence 38:36 +14 10/72 3- 7 0- 2 4- 9 9/42 7/19 2/64 2/64 1/35 2/24 10/36 2
CLARK, Earl 36:29 +19 22/72 2- 7 3- 3 9-13 10/42 3/18 4/62 4/63 0/31 1/23 7/35 1
SAMUELS, Samardo 21:39 +12 10/47 4- 5 0- 0 2- 4 5/22 2/11 1/41 4/42 1/18 1/11 3/21 3
McGEE, Andre 21:22 +17 3/45 0- 0 1- 1 0- 0 1/26 2/14 2/38 0/38 0/15 0/13 1/20 4
SMITH, Jerry 22:09 +14 8/40 1- 3 2- 3 0- 0 6/24 0/11 0/36 2/35 0/12 0/11 2/17 0
KNOWLES, Preston 17:15 + 9 10/35 2- 4 2- 3 0- 0 7/20 1/ 6 0/29 0/31 0/22 1/13 0/20 2
SOSA, Edgar 18:38 + 1 6/31 3- 3 0- 0 0- 0 3/18 2/ 6 0/29 2/29 0/20 0/11 0/17 3
SCOTT, Will 02:00 - 1 0/ 5 0- 0 0- 0 0- 0 0/ 2 0/ 2 0/ 5 0/ 4 0/ 1 0/ 0 1/ 1 1
SWOPSHIRE, Jared 03:31 - 1 0/ 4 0- 0 0- 0 0- 0 0/ 2 0/ 1 0/ 5 1/ 4 0/ 4 0/ 1 0/ 2 1
GOODE, George 05:57 - 4 0/ 5 0- 1 0- 0 0- 0 1/ 9 0/ 2 0/ 8 0/ 7 0/ 9 1/ 7 0/ 9 0
JENNINGS, Terrence 12:24 +10 7/24 1- 2 0- 0 5- 6 2/13 0/ 6 1/18 0/18 1/ 8 1/ 6 1/ 7 4
TOTALS 40:00 76 16-32 8-12 20-32 44 17/24 10/67 16/67 3/35 8/24 26/37 21
. 0.500 0.667 0.625 0.708 0.149 0.239 0.086 0.333 0.703

GU Min +/- Pts 2PM-A 3PM-A FTM-A FGA A Stl TO Blk OR DR PF
Summers, DaJuan 28:21 -20 4/38 1- 4 0- 4 2- 4 8/42 1/13 2/50 0/49 1/18 0/32 4/13 3
Wright, Chris 36:02 -12 12/52 2- 8 1- 4 5- 8 12/47 1/15 0/60 4/61 0/30 1/35 3/23 4
Mescheriakov, Nikita 14:24 -14 5/21 0- 0 1- 1 2- 2 1/12 1/ 5 0/27 3/27 0/15 0/ 9 0/ 8 4
Monroe, Greg 29:52 - 7 10/45 4- 7 0- 0 2- 2 7/32 1/11 2/50 3/51 0/23 1/20 4/18 3
Freeman, Austin 27:02 -20 8/38 4- 5 0- 1 0- 1 6/34 0/ 9 2/47 0/46 0/22 1/27 2/18 3
Clark, Jason 22:37 -10 4/30 1- 3 0- 1 2- 2 4/26 1/ 9 1/36 2/35 0/18 2/18 0/13 2
Sapp, Jessie 25:02 - 3 9/41 2- 5 1- 5 2- 4 10/36 2/12 4/40 0/40 0/21 1/25 1/18 4
Vaughn, Julian 08:37 - 5 4/12 2- 2 0- 0 0- 0 2/16 0/ 3 0/11 0/11 0/ 8 3/13 0/ 6 1
Sims, Henry 03:12 - 3 2/ 4 1- 1 0- 0 0- 0 1/ 4 0/ 1 0/ 6 0/ 6 0/ 1 0/ 2 0/ 0 1
Wattad, Omar 04:51 + 4 0/ 9 0- 0 0- 0 0- 0 0/ 6 0/ 2 0/ 8 1/ 9 0/ 4 0/ 4 0/ 3 0
TOTALS 40:00 58 17-35 3-16 15-23 51 7/20 11/67 15/67 1/32 11/37 16/24 25
. 0.486 0.188 0.652 0.350 0.164 0.224 0.031 0.297 0.667

Efficiency: Louisville 1.134, GU 0.866
eFG%: Louisville 0.636, GU 0.422
Substitutions: Louisville 32, GU 32

2-pt Shot Selection:
Dunks: Louisville 3-3, GU 4-5
Layups/Tips: Louisville 7-16, GU 8-16
Jumpers: Louisville 6-13, GU 5-14

Fast break pts: Louisville 11 (0.196), GU 4 (0.093)
Seconds per off. poss: Louisville 18.0, GU 17.8

Saturday, February 21, 2009

Recap: Marquette 78, Georgetown 72

Sorry for the tardy post - it'll have to be a numbers dump for right now. I'll try to add some commentary tomorrow.

Edited to add:
- Doesn't look like I'll have time to add much, so I'll just round up some links and quotes from the blogosphere. As always, see HoyaTalk and HoyaSaxa for discussions and links from the traditional media.


HoyaHoops
The Hoyas missed shots from close range, failed to collect defensive rebounds, and turned the ball over at critical times. Marquette meanwhile continued their remarkably consistent play and pulled away in the final moments.


Cracked Sidewalks
The game was a see-saw battle through the first 32 minutes. The final 8, Marquette slowly outlasted Georgetown, playing tight defense, nurturing a 2 point lead into a 4 point lead, into a 6 point lead, outscoring GTown 17-10 over the final stretch, not counting an uncontested 3 as time expired and the game decided.

Georgetown sinks to 5-9 in the Big East, their NCAA chances slipping away, despite their schedule, which is the 3rd toughest in the country. One could see them winning the NIT with their talent, unless they go on a serious run in the BET.


Robert Churchwell's Revenge
Greg Monroe is an ultra-talented 6-foot-10 center for whom the Marquette Golden Eagles had no answer today. If the Georgetown Hoyas had wanted to, and if Monroe had been up for it, they could have run the entire second-half offense through him and won this game. He wasn't in foul trouble, the defense was working, and there were plenty of half-court sets, even some transition opportunities, that called for Monroe to forcefully take the ball to the basket and score.

But that doesn't work when all the guy wants to do is pass. It doesn't work when the offense works to get the big man the ball inside only to watch him dish it off at the last minute when the right play would be to shoot a hook shot, or even dunk the ball and scream the roof off the place like a real, monster big man does.

It doesn't work when there's nobody to get in Greg Monroe's ear and shout, "Okay! We get it! You're a great passer! But for God's sake, man! You're 6-foot-10! Freaking SCORE already!"


Yet Another Basketball Blog
I knew it was going to be a long day for Georgetown when a fan shouted “[obsenity] Marquette” during the national anthem. There’s just no good karma coming out of that one.


CasualHoya
We didn't play that poorly today.

If anyone wants to see me jump off the Key Bridge, I suggest you head to Georgetown immediately.


Hire Esherick
If I hear another person talk about how we can get into the Tourney by winning here and doing a backflip there, I am to throw my shoe at them.

Maybe even both shoes if the person is funny looking.


Let's run the numbers:

TEMPO-FREE BOX SCORE

. Home Visitor
. GU Marquette
. 1st Half 2nd Half Total 1st Half 2nd Half Total
Pace 31 30 62

Effic. 138.9 90.4 114.9 138.9 109.8 124.4

eFG% 64.1 50.0 58.2 70.0 40.0 55.0
TO% 12.6 25.8 19.1 15.8 3.2 9.6
OR% 43.8 15.4 31.0 30.8 42.1 37.5
FT Rate 12.5 30.4 20.0 10.0 50.0 30.0

Assist Rate 47.1 36.4 42.9 50.0 63.6 55.2
Block Rate 11.1 10.0 10.5 9.5 0.0 5.4
Steal Rate 9.5 0.0 4.8 6.3 16.2 11.2

2FG% 47.6 62.5 54.1 66.7 45.0 55.3
3FG% 63.6 14.3 44.4 50.0 20.0 36.4
FT% 75.0 71.4 72.7 66.7 66.7 66.7


INDIVIDUAL NET POINTS STATS

GU Off Poss Individ Def Individ
Player Poss Used ORtg Pts Prod Poss DRtg Pts Allow Net Pts
Summers, DaJuan 48 15.3 66.7 10.2 47 115.0 10.8 -0.6
Wright, Chris 55 12.8 127.5 16.3 56 109.0 12.2 +4.1
Mescheriakov, Nikita 22 2.5 52.8 1.3 24 137.9 6.6 -5.3
Monroe, Greg 56 11.3 145.5 16.5 57 121.6 13.9 +2.6
Freeman, Austin 56 8.1 144.4 11.8 54 117.7 12.7 -1.0
Clark, Jason 22 5.3 130.6 6.9 20 127.5 5.1 +1.8
Sapp, Jessie 47 6.0 84.7 5.1 48 113.2 10.9 -5.8
Vaughn, Julian 7 0.8 200.0 1.5 6 100.0 1.2 +0.3
Sims, Henry 2 0.0 - 0.0 3 133.3 0.8 -0.8
TOTALS 63 62.1 112.1 69.6 63 117.7 74.2 -4.6

Marquette Off Poss Individ Def Individ
Player Poss Used ORtg Pts Prod Poss DRtg Pts Allow Net Pts
JAMES, Dominic 63 10.2 64.7 6.6 63 101.1 12.7 -6.2
BURKE, Dwight 27 2.7 133.5 3.6 26 119.6 6.2 -2.6
MCNEAL, Jerel 63 18.5 115.7 21.4 63 107.6 13.6 +7.9
MATTHEWS, Wesley 61 11.1 157.7 17.5 60 106.1 12.7 +4.7
HAYWARD, Lazar 60 15.7 118.5 18.5 59 112.5 13.3 +5.3
CUBILLAN, David 3 0.0 - 0.0 5 149.3 1.5 -1.5
BUTLER, Jimmy 38 3.4 203.5 6.8 39 114.4 8.9 -2.1
TOTALS 63 61.5 121.1 74.5 63 109.4 68.9 +5.5


HD BOX SCORE

Marquette vs GU
02/21/09 2:00 at Verizon Center
Final score: Marquette 78, GU 72

Marquette Min +/- Pts 2PM-A 3PM-A FTM-A FGA A Stl TO Blk OR DR PF
JAMES, Dominic 40:00 + 6 6/78 2- 7 0- 2 2- 4 9/60 3/27 4/63 2/63 0/37 0/34 1/30 4
BURKE, Dwight 18:09 - 4 2/29 1- 1 0- 0 0- 2 1/23 0/ 9 0/26 0/27 0/17 2/15 2/12 4
MCNEAL, Jerel 40:00 + 6 22/78 7-11 2- 6 2- 4 17/60 7/20 1/63 2/63 0/37 1/34 5/30 3
MATTHEWS, Wesley 38:34 + 9 23/76 4- 8 5- 8 0- 0 16/58 3/19 2/60 0/61 1/37 2/32 1/29 1
HAYWARD, Lazar 36:58 + 6 17/74 4- 7 1- 6 6- 6 13/56 2/22 0/59 2/60 0/34 4/32 7/29 2
CUBILLAN, David 02:49 - 3 0/ 4 0- 0 0- 0 0- 0 0/ 4 0/ 2 0/ 5 0/ 3 0/ 1 0/ 2 0/ 0 0
BUTLER, Jimmy 23:30 +10 8/51 3- 4 0- 0 2- 2 4/39 1/17 0/39 0/38 1/22 1/21 4/20 3
TOTALS 40:00 78 21-38 8-22 12-18 60 16/29 7/63 6/63 2/37 12/32 20/29 17
. 0.553 0.364 0.667 0.552 0.111 0.095 0.054 0.375 0.690

GU Min +/- Pts 2PM-A 3PM-A FTM-A FGA A Stl TO Blk OR DR PF
Summers, DaJuan 30:42 + 2 12/59 3- 7 2- 4 0- 0 11/39 0/18 0/47 5/48 0/26 1/19 3/26 5
Wright, Chris 34:33 - 1 17/66 2- 6 2- 5 7- 7 11/50 4/21 1/56 1/55 0/33 0/28 2/32 1
Mescheriakov, Nikita 15:03 -10 3/23 0- 0 1- 1 0- 0 1/15 1/ 8 0/24 2/22 0/16 0/ 8 0/13 5
Monroe, Greg 35:26 - 4 13/68 6- 9 0- 0 1- 3 9/48 2/20 1/57 0/56 3/33 4/25 4/31 1
Freeman, Austin 34:53 + 5 16/70 5- 5 2- 5 0- 1 10/52 2/20 0/54 2/56 0/30 0/27 5/28 1
Clark, Jason 14:08 - 1 6/25 3- 5 0- 1 0- 0 6/19 1/ 7 0/20 1/22 1/15 2/11 1/10 3
Sapp, Jessie 28:50 -15 3/45 0- 3 1- 2 0- 0 5/44 2/17 1/48 1/47 0/28 2/26 4/25 1
Vaughn, Julian 04:34 - 2 2/ 4 1- 2 0- 0 0- 0 2/ 7 0/ 1 0/ 6 0/ 7 0/ 5 0/ 5 0/ 3 0
Sims, Henry 01:51 - 4 0/ 0 0- 0 0- 0 0- 0 0/ 1 0/ 0 0/ 3 0/ 2 0/ 4 0/ 1 0/ 2 0
TOTALS 40:00 72 20-37 8-18 8-11 55 12/28 3/63 12/63 4/38 9/29 20/32 17
. 0.541 0.444 0.727 0.429 0.048 0.190 0.105 0.310 0.625

Efficiency: Marquette 1.238, GU 1.143
eFG%: Marquette 0.550, GU 0.582
Substitutions: Marquette 18, GU 28

2-pt Shot Selection:
Dunks: Marquette 0-0, GU 3-3
Layups/Tips: Marquette 15-20, GU 11-20
Jumpers: Marquette 6-18, GU 6-14

Fast break pts: Marquette 4 (0.061), GU 4 (0.062)
Seconds per off. poss: Marquette 18.8, GU 19.3

Wednesday, February 18, 2009

Recap: Georgetown 65, So. Florida 40

It's a new Hoya Prospectus tradition - when Georgetown wins a game, I watch the replay on ESPN360.com and make pithy comments, grouped by TV timeout and aided by tempo-free stats generated from the box score and play-by-play.

Here we go:

1st half - 1st TV timeout [GU 6, USF 0]
  • N. Mescheriakov starts over J. Sapp again; it's not clear to my why JTIII is doing this - I'd be interested to hear his rationale after the season is over (or sooner).
  • The crowd is sparse - some contrast to Saturday's game in the Carrier Dome.
  • Wentzel is pontificating on Georgetown's rebounding woes - only thing is that Georgetown has been rebounding respectfully since the Pitt game. In the 11 games since Pitt, the Hoyas have averaged 50.7% total rebounding.
  • Georgetown has committed three offensive fouls (only two called) on two moving screens (Mescheriakov [not called] and C. Wright) and a chicken-wing by G. Monroe. I don't mind these if this is a sign of aggressiveness on offense.

1st half - 2nd TV timeout [GU 12, USF 8]
  • J. Clark (6'2" with a 6'8" wingspan, we learn) is the 1st sub in, for A. Freeman.
  • Mescheriakov's airball 3 is answered by a good 3FG by D. Jones. Ughh.
  • The Bulls are missing a bunch of close-in shots; they seem to be rushed, although some credit to the Hoyas defense [USF shot 4/9 on dunks, layups and tip-ins in the half].
  • Sapp in for Mescheriakov after a 3FG too early in the shot-clock - Wentzel correctly points it out.
  • USF Bulls = Dominique Jones [29.0 % Poss. coming in], and a cast of thousands. Meanwhile, D. Summers commits his traditional 2nd foul early in the 1st half. H. Sims should see some extended minutes now.

1st half - 3rd TV timeout [GU 17, USF 13]
  • Sapp with a nice drive and dish to Wright for 3FG - no chemistry issues here.
  • Monroe picks G. Gilchrist clean under the Hoya basket - Monroe is 82nd in the nation in steal rate [3.87%], just below DeJuan Blair [3.94%]. It just reinforces what great hands he has for someone his size - and no, I won't check to see if anyone as tall as Monroe has as high a steal rate.

1st half - 4th TV timeout [GU 31, USF 13]
  • Georgetown gets a 10-second call the 1st time USF shows full court pressure.
  • Wright drives and dishes to Sapp for 3FG on the break - returning the favor.
  • Sapp hits another 3FG on the break; Hoyas up 10. Why is Mescheriakov starting?
  • Gilchrist picks up his 3rd PF. In spite of this, he looks impressive for a freshman; I wonder how the Hoyas would have fared if he would have ended up at Georgetown (and yes, I am aware of the baggage that made this impossible).
  • Jessie Sapp with 8 points now, for a 16 point lead. The Bulls might want to consider going zone.
  • Well, they went zone and Georgetown immediately runs a high-low play to Freeman for 2FG and the foul. Never mind.
  • USF didn't score during that segment - two turnovers, three missed jumpers, a missed layup and a missed FT.

1st half -
Halftime [GU 34, USF 17]
  • Clark hits a 3FG - He's quietly shooting a high percentage from outside [9/21 3FG his last 10 games].
  • J. Vaughn shot a little early at the end of the half, then compounded the mistake by committing an over-the-back foul trying to get an offensive rebound. Again, an aggressive mistake which is better than a passive one.
  • C. Wright ends the half with a J. Rivers (he hit the side of the backboard).
  • USF shot 5/16 2FG, 1/6 3FG, 4/10 FT in the half. Ugly.
  • GU shot 8/16 2FG, 4/7 3FG, 6/7 FT in the half. Nice.


2nd half - 1st TV timeout [GU 41, USF 23]

  • Wright opens the half with a drive for 2 FTs - Georgetown's FT rate has dropped off noticeably during the slump [FT Rate = 27.2% in the last 5 games]
  • Another drive (this time for a layup) by Wright while I type.
  • Stan Heath takes a timeout after GU opens the Vesper half 6-0.
  • USF misses another couple of FTs trying to complete and-1s. Not a good shooting night for them.

2nd half - 2nd TV timeout [GU 46, USF 30]
  • Summers finally gets on the board with a 3FG. Could mean less time for Sims this half (he actually came in soon after for Mescheriakov).
  • Wright leads another successful fast break - I think he's doing this to spite CasualHoya.
  • The Hoyas commit 3 consecutive turnovers in a row, as USF closes to 16 points.

2nd half - 3rd TV timeout [GU 53, USF 31]

  • Another GU turnover (4 in a row).
  • Mescheriakov pulled down a couple of defensive rebounds, sandwiching a missed wide-open 3FG. I wonder if he makes those in practice? - he'd be quite serviceable if he could just make the open 3FG.
  • Freeman once again got hung out by getting the ball with about :03 left on the shot clock.
  • Another Hoya fast break for a dunk by Summers. And another fast break - layup for Wright. USF won't score in transition all game. CasualHoya is getting punked right now.

2nd half - 4th TV timeout [GU 63 , USF 38]
  • Having run the numbers, I know that USF won't make a 3FG this half (0/6), and only shot 5/13 on FT, which takes away all of the tension of watching this game. Yeah, normally I'd still be nervous watching Georgetown up 20+ with 7 minutes left - so what.
  • Another fast break for G'town - just in case CasualHoya is still reading.
  • Clark runs a nice backdoor cut with a pass from J. Vaughn, as garbage time has begun.
  • D. Jones just led a fast break and finished by hitting the underside of the basket. Ughh again.
  • Each team will score one layup the rest of the way (I peeked at the play-by-play).

2nd half - Final [GU 65 , USF 40]
  • With the big lead in the 2nd half, Georgetown didn't shoot any 2-pt jumpers which shows excellent discipline.
  • Sapp had the opportunity to shoot a 3FG with about :20 left and the shot clock off, but chooses to run out the clock instead. It's subtle, but that tells me he's not frustrated with his offense anymore. Good sign.
  • Ballgame.

Great shooting night for Georgetown, terrible shooting night for South Florida. The Hoyas got careless with the basketball in the 2nd half, once the game's outcome was clear.

Player of the game is Chris Wright.


Let's run the numbers:

TEMPO-FREE BOX SCORE

. Visitor Home
. GU USF
. 1st Half 2nd Half Total 1st Half 2nd Half Total
Pace 30 32 62

Effic. 111.8 94.9 103.3 55.9 70.4 63.5

eFG% 60.9 70.0 65.1 29.5 36.0 33.0
TO% 19.7 39.8 30.2 19.7 21.4 20.7
OR% 8.3 44.4 23.8 19.0 28.6 23.8
FT Rate 30.4 25.0 27.9 45.5 52.0 48.9

Assist Rate 66.7 69.2 68.0 33.3 100.0 73.3
Block Rate 6.2 5.3 5.7 6.2 0.0 3.4
Steal Rate 13.2 18.4 15.9 3.3 18.4 11.1

2FG% 50.0 84.6 65.5 31.2 47.4 40.0
3FG% 57.1 28.6 42.9 16.7 0.0 8.3
FT% 85.7 60.0 75.0 40.0 38.5 39.1


INDIVIDUAL NET POINTS STATS

GU Off Poss Individ Def Individ
Player Poss Used ORtg Pts Prod Poss DRtg Pts Allow Net Pts
Summers, DaJuan 39 3.8 180.2 6.9 37 54.6 4.0 +2.8
Mescheriakov, Nikita 36 3.3 18.5 0.6 35 40.2 2.8 -2.2
Monroe, Greg 44 14.0 87.4 12.3 45 39.2 3.5 +8.7
Wright, Chris 47 14.4 126.6 18.2 44 60.6 5.3 +12.9
Freeman, Austin 43 4.6 95.1 4.4 43 66.6 5.7 -1.3
Clark, Jason 24 6.0 111.2 6.6 24 81.3 3.9 +2.7
Sapp, Jessie 28 6.9 138.1 9.5 30 79.6 4.8 +4.7
Vaughn, Julian 18 6.5 50.2 3.3 16 69.4 2.2 +1.0
Sims, Henry 31 0.4 233.3 0.9 31 58.6 3.6 -2.8
TOTALS 62 59.8 104.6 62.6 61 59.0 36.0 +26.6

USF Off Poss Individ Def Individ
Player Poss Used ORtg Pts Prod Poss DRtg Pts Allow Net Pts
ESPINOSA, Eladio 15 3.9 43.5 1.7 17 134.6 4.6 -2.9
RIVAS, Alex 39 7.4 76.1 5.6 39 74.8 5.8 -0.2
HOWARD, Chris 57 10.6 64.7 6.8 60 99.0 11.9 -5.0
JONES, Dominique 57 16.7 69.4 11.6 59 101.3 12.0 -0.4
VERDEJO, Jesus 47 7.2 10.7 0.8 45 102.0 9.2 -8.4
BELARDO, Gaby 8 0.3 200.0 0.6 8 77.0 1.2 -0.6
DANIELS, B.J 5 3.0 0.0 0.0 6 133.3 1.6 -1.6
LEEMOW, Justin 15 0.0 - 0.0 17 105.0 3.6 -3.6
KARDOK, Ryan 3 0.5 200.0 1.0 2 100.0 0.4 +0.6
GILCHRIST, Augustus 39 11.2 81.6 9.1 37 113.2 8.4 +0.7
WILLIAMS, Aris 20 0.0 - 0.0 20 102.6 4.1 -4.1
TOTALS 61 60.8 61.3 37.3 62 101.1 62.7 -25.5


HD BOX SCORE

GU vs USF
2/18/09 7 p.m. at The Sun Dome - Tampa, Fla.
Final score: GU 65, USF 40

GU Min +/- Pts 2PM-A 3PM-A FTM-A FGA A Stl TO Blk OR DR PF
Summers, DaJuan 24:12 +14 8/41 1- 2 2- 4 0- 0 6/27 3/14 3/37 0/39 0/21 0/12 3/26 2
Mescheriakov, Nikita 24:22 +14 0/33 0- 0 0- 3 0- 0 3/27 1/14 1/35 0/36 0/22 0/15 5/26 3
Monroe, Greg 27:42 +26 12/53 4- 7 0- 0 4- 4 7/28 2/16 3/45 5/44 0/24 0/11 10/30 3
Wright, Chris 28:59 +31 17/57 5- 7 1- 2 4- 5 9/33 6/15 1/44 4/47 0/24 0/15 3/31 1
Freeman, Austin 28:17 +17 7/43 3- 3 0- 0 1- 3 3/27 1/12 0/43 2/43 0/23 0/15 2/27 1
Clark, Jason 15:57 + 1 9/22 3- 4 1- 1 0- 0 5/21 0/ 6 0/24 2/24 0/15 2/12 2/16 1
Sapp, Jessie 19:33 + 8 10/30 2- 3 2- 3 0- 0 6/19 1/ 7 0/30 3/28 0/19 2/ 8 1/20 3
Vaughn, Julian 12:18 - 1 2/12 1- 3 0- 1 0- 0 4/15 2/ 4 1/16 2/18 1/11 1/10 2/12 3
Sims, Henry 18:40 +15 0/34 0- 0 0- 0 0- 0 0/18 1/12 1/31 0/31 1/16 0/ 7 3/22 1
TOTALS 40:00 65 19-29 6-14 9-12 43 17/25 10/61 19/62 2/35 5/21 32/42 18
. 0.655 0.429 0.750 0.680 0.164 0.306 0.057 0.238 0.762

USF Min +/- Pts 2PM-A 3PM-A FTM-A FGA A Stl TO Blk OR DR PF
ESPINOSA, Eladio 11:47 -14 2/ 9 1- 2 0- 0 0- 0 2/13 0/ 2 0/17 2/15 0/ 5 1/12 0/ 4 2
RIVAS, Alex 24:09 -14 9/22 4- 5 0- 0 1- 5 5/31 0/ 5 3/39 1/39 1/19 1/28 5/12 1
HOWARD, Chris 37:36 -25 6/38 0- 3 0- 1 6- 8 4/46 4/14 2/60 3/57 0/27 1/42 3/19 2
JONES, Dominique 37:07 -25 12/36 4-11 1- 5 1- 5 16/46 4/ 9 1/59 2/57 0/27 2/42 2/19 2
VERDEJO, Jesus 29:44 -12 0/32 0- 3 0- 4 0- 1 7/36 2/12 0/45 0/47 0/20 0/33 0/13 0
BELARDO, Gaby 05:43 - 1 0/ 6 0- 1 0- 0 0- 0 1/ 7 0/ 2 0/ 8 0/ 8 0/ 3 1/ 5 1/ 4 0
DANIELS, B.J 03:28 - 6 0/ 2 0- 0 0- 0 0- 0 0/ 1 0/ 1 0/ 6 3/ 5 0/ 5 0/ 0 0/ 4 1
LEEMOW, Justin 11:03 - 4 0/13 0- 0 0- 0 0- 0 0/13 0/ 5 0/17 0/15 0/10 0/10 2/ 9 1
KARDOK, Ryan 02:06 + 0 0/ 2 0- 0 0- 0 0- 0 0/ 1 1/ 1 0/ 2 0/ 3 0/ 2 0/ 0 0/ 2 0
GILCHRIST, Augustus 23:36 -13 11/28 5-10 0- 2 1- 4 12/27 0/ 5 0/37 2/39 0/17 2/25 1/12 3
WILLIAMS, Aris 13:41 -11 0/12 0- 0 0- 0 0- 0 0/14 0/ 4 1/20 0/20 0/10 0/13 1/ 7 1
TOTALS 40:00 40 14-35 1-12 9-23 47 11/15 7/62 13/61 1/29 10/42 16/21 13
. 0.400 0.083 0.391 0.733 0.113 0.213 0.034 0.238 0.762

Efficiency: GU 1.048, USF 0.656
eFG%: GU 0.651, USF 0.330
Substitutions: GU 32, USF 32

2-pt Shot Selection:
Dunks: GU 1-1, USF 2-2
Layups/Tips: GU 17-23, USF 10-22
Jumpers: GU 1-5, USF 2-11

Fast break pts: GU 16 (0.286), USF 0 (0.000)
Seconds per off. poss: GU 19.4, USF 18.9


That's it for tonight. Not a pretty game, but at least it was no Penn State / Illinois clash (Hi! Dan Hanner).


Season stats will get updated tomorrow, hopefully.

Saturday, February 14, 2009

Recap: Syracuse 98, Georgetown 94 [OT]

The Hoyas nearly stole one at the buzzer in Syracuse, but ended up losing for the 5th straight time in the frozen hinterlands to the Orangemen. This is the 2nd straight game lost in overtime for Georgetown, but tonight's overtime loss was preceded by a furious 16-point comeback in the last 8 minutes of regulation.

This was also the second straight G'town-Syracuse game in which K. Ongenaet has assaulted D. Summers - tonight with a swinging elbow to the back of the head which lead to Ongenaet's ejection. Is anyone aware of any sort of history between these two? I didn't see any evidence in either game that Summers did anything to provoke the attacks.

With the loss, Georgetown (13-10, 4-8) faces a monumental challenge to make the NCAA tournament, with three of the next four games against KenPom.com top-25 teams.


Let's run the numbers:

TEMPO-FREE BOX SCORE

. Visitor Home
. GU Syracuse
. 1st Half 2nd Half Total 1st Half 2nd Half Total
Pace 31 34 66

Effic. 102.0 137.4 122.4 105.1 144.1 127.6

eFG% 48.4 64.3 57.5 45.0 72.6 59.0
TO% 31.9 13.3 20.8 22.3 13.3 16.9
OR% 61.1 45.0 52.6 50.0 31.2 41.2
FT Rate 19.4 26.2 23.3 23.3 87.1 55.7

Assist Rate 46.2 69.6 61.1 50.0 75.0 65.6
Block Rate 5.3 9.5 7.5 26.3 9.1 17.1
Steal Rate 6.4 6.7 6.5 9.6 4.4 6.5

2FG% 47.4 68.2 58.5 47.4 71.4 60.0
3FG% 33.3 40.0 37.5 27.3 50.0 38.1
FT% 33.3 72.7 58.8 85.7 74.1 76.5

It's getting late, so just a few quick thoughts:
  • The Orangemen had a block party in the 1st half (more than 1 in 4 G'town 2FGA was blocked), which likely lead to the low 2FG% for the Hoyas in the half.
  • Georgetown exploited seams in the 2-3 zone to rack up a ton of offensive rebounds
  • The Hoyas' carelessness with the basketball in the first half was a big reason they trailed at the half.
  • Syracuse came into the game 3rd best in the country at defensive FT Rate (3rd fewest FTA/FGA), and lived up to that billing.
  • In any game that goes to overtime, it's easy to look at FT shooting as the difference between a win and a loss, but Syracuse shot well above their season average (63.8%), while Georgetown shot well below their season average (72.1%).

INDIVIDUAL NET POINTS STATS

GU Off Poss Individ Def Individ
Player Poss Used ORtg Pts Prod Poss DRtg Pts Allow Net Pts
Summers, DaJuan 70 13.9 133.1 18.6 71 115.5 16.4 +2.2
Mescheriakov, Nikita 40 5.0 46.8 2.4 40 120.7 9.7 -7.3
Monroe, Greg 62 11.9 138.6 16.4 60 105.5 12.7 +3.8
Wright, Chris 69 12.6 148.9 18.7 70 112.8 15.8 +3.0
Freeman, Austin 69 11.8 137.2 16.2 68 120.2 16.4 -0.1
Clark, Jason 9 5.1 42.6 2.2 9 176.2 3.2 -1.0
Sapp, Jessie 45 7.4 132.3 9.8 45 134.1 12.1 -2.3
Vaughn, Julian 16 4.4 91.1 4.0 18 150.8 5.4 -1.4
Sims, Henry 10 4.3 39.3 1.7 9 147.1 2.6 -1.0
TOTALS 78 76.4 117.7 90.0 78 120.7 94.2 -4.2

Syracuse Off Poss Individ Def Individ
Player Poss Used ORtg Pts Prod Poss DRtg Pts Allow Net Pts
JACKSON, Rick 54 8.6 121.9 10.4 54 129.8 14.0 -3.6
HARRIS, Paul 63 12.2 108.6 13.2 63 115.9 14.6 -1.4
ONUAKU, Arinze 65 15.6 117.3 18.3 65 92.3 12.0 +6.3
FLYNN, Jonny 73 23.7 123.4 29.2 72 119.4 17.2 +12.1
DEVENDORF, Eric 75 10.0 132.8 13.3 74 127.6 18.9 -5.6
RAUTINS, Andy 37 5.2 202.5 10.5 38 95.1 7.2 +3.3
ONGENAET, Kristof 13 1.1 61.1 0.7 13 88.8 2.3 -1.6
JOSEPH, Kris 10 0.0 - 0.0 11 184.4 4.1 -4.1
TOTALS 78 76.3 125.3 95.7 78 115.7 90.3 +5.4

Georgetown got strong offensive games by the 5 normal starters (N. Mescheriakov started for J. Sapp today, hopefully in a one-time experiment).

Summers, C. Wright and G. Monroe were all positive contributors today, with A. Freeman just missing the cut. Monroe also tied for game-high in plus/minus, despite being on the losing side. Any chance we can clone him in the off-season?

HD BOX SCORE

GU vs Syracuse
2/14/09 12:02 p.m. at Carrier Dome, Syracuse, NY
Final score: Syracuse 98, GU 94

GU Min +/- Pts 2PM-A 3PM-A FTM-A FGA A Stl TO Blk OR DR PF
Summers, DaJuan 40:34 - 2 17/87 3- 7 3-11 2- 2 18/68 4/27 1/71 2/70 0/37 5/35 3/31 3
Mescheriakov, Nikita 23:49 - 7 0/40 0- 0 0- 4 0- 0 4/36 3/17 0/40 2/40 1/23 1/19 0/20 4
Monroe, Greg 33:45 +12 16/82 8- 9 0- 0 0- 1 9/58 2/23 2/60 3/62 0/27 5/27 6/22 4
Wright, Chris 41:31 + 0 25/85 5- 7 5- 8 0- 0 15/67 6/22 1/70 2/69 1/38 0/35 5/32 5
Freeman, Austin 40:04 + 2 19/86 3- 6 3- 6 4- 8 12/64 6/27 1/68 3/69 0/35 1/31 1/29 3
Clark, Jason 04:00 - 9 2/ 6 1- 3 0- 0 0- 0 3/ 8 0/ 2 0/ 9 2/ 9 0/ 3 1/ 5 1/ 1 1
Sapp, Jessie 24:44 + 3 9/62 2- 4 1- 4 2- 2 8/46 1/19 0/45 0/45 0/20 2/24 1/20 2
Vaughn, Julian 11:15 -16 5/12 2- 4 0- 0 1- 2 4/16 0/ 3 0/18 0/16 1/13 1/11 1/12 2
Sims, Henry 05:18 - 3 1/10 0- 1 0- 0 1- 2 1/ 7 0/ 4 0/ 9 2/10 0/ 4 1/ 3 0/ 3 1
TOTALS 45:00 94 24-41 12-33 10-17 74 22/36 5/78 17/78 3/40 19/38 20/34 25
. 0.585 0.364 0.588 0.611 0.064 0.218 0.075 0.500 0.588

Syracuse Min +/- Pts 2PM-A 3PM-A FTM-A FGA A Stl TO Blk OR DR PF
JACKSON, Rick 32:44 + 2 13/71 6- 7 0- 0 1- 3 7/44 2/18 0/54 2/54 2/30 2/22 2/26 2
HARRIS, Paul 35:12 + 4 9/83 2- 7 0- 1 5- 6 8/47 3/25 2/63 2/63 0/28 3/25 2/24 3
ONUAKU, Arinze 39:49 +12 15/82 6-10 0- 0 3- 7 10/56 1/22 2/65 3/65 4/29 7/31 6/30 3
FLYNN, Jonny 41:57 + 9 25/93 5- 9 0- 3 15-16 12/56 13/25 0/72 4/73 1/38 0/31 4/38 1
DEVENDORF, Eric 43:17 - 1 23/93 3- 5 5- 9 2- 2 14/60 1/23 0/74 1/75 0/41 0/34 2/37 1
RAUTINS, Andy 21:59 + 3 13/45 2- 2 3- 7 0- 0 9/30 1/10 1/38 1/37 0/23 1/19 1/23 5
ONGENAET, Kristof 06:58 + 0 0/11 0- 0 0- 1 0- 0 1/10 0/ 3 0/13 0/13 0/10 1/ 7 0/ 9 1
JOSEPH, Kris 03:04 - 9 0/12 0- 0 0- 0 0- 0 0/ 2 0/ 2 0/11 0/10 0/ 6 0/ 1 0/ 3 1
TOTALS 45:00 98 24-40 8-21 26-34 61 21/32 5/78 14/78 7/41 14/34 19/38 17
. 0.600 0.381 0.765 0.656 0.064 0.179 0.171 0.412 0.500


Efficiency: Syracuse 1.256, GU 1.205
eFG%: Syracuse 0.590, GU 0.568
Substitutions: Syracuse 20, GU 29

2-pt Shot Selection:
Dunks: Syracuse 5-6, GU 1-1
Layups/Tips: Syracuse 10-18, GU 14-21
Jumpers: Syracuse 9-16, GU 9-19

Fast break pts: Syracuse 23 (0.319), GU 13 (0.155)
Seconds per off. poss: Syracuse 16.4, GU 18.3

Tuesday, February 10, 2009

It's the (2nd half) defense, stupid

Following up on a point made by SFHoya99 over at Hoyatalk . . .


While I'm sure there is much gnashing of teeth in Hoya Nation, there is also quite a bit of casting about for who or what is to blame for the collapse of the team over the last 6 weeks.

One thing that I've noticed is that Georgetown seems to be losing the 2nd half in most games during this stretch. Taking the 12 games played from at UConn (29-Dec) through vs. Cinci (7-Feb), Georgetown has been outscored by their opponent by 41 points in the second half (or 3.4 points/game). In fact, the Hoyas have outscored their opponent by more than 5 points in only one 2nd half during this stretch - versus Providence.

So I thought I would generate a tempo-free box score for these last 12 games, broken out by half:
.                      Offense                            Defense
. 1st Half 2nd Half Total 1st Half 2nd Half Total
Pace 31.5 33.3 64.8

Eff. 100.7 104.9 102.9 98.6 115.0 107.1
Eff. Margin 2.1 -10.1 -4.2

eFG% 51.4 50.0 50.7 49.2 54.0 51.7
TO% 23.3 19.4 21.3 23.0 18.9 20.9
OR% 36.9 32.1 34.5 33.2 42.9 38.1
FTA/FGA 20.9 54.5 37.3 22.2 43.1 32.9
FTM/FGA 14.2 38.1 25.8 16.4 30.4 23.5

Assist Rate 60.5 58.6 59.6 55.7 54.3 54.9
Block Rate 13.5 10.4 11.9 9.0 7.8 8.4
Steal Rate 10.9 9.8 10.3 12.5 10.8 11.6

2FG% 49.8 51.9 50.8 47.9 54.5 51.4
3FG% 36.4 30.6 33.7 34.5 35.2 34.8
FT% 67.6 69.8 69.2 73.6 70.5 71.6

What can we learn? Well, it becomes clear that the problem for the Hoyas after halftime is the defense, not the offense. In fact, the offense actually becomes slightly more efficient in the 2nd half, largely through increased trips to the FT line and fewer turnovers.

However, the defense is much, much worse in the second half. The problems span the entire gamut - eFG% is worse (due to worse 2FG shooting defense), fewer turnovers are created, more offensive rebounds are allowed and more FTs are allowed (although that last stat may be due to giving fouls at the end of the game).

Interestingly, teams aren't shooting significantly better from outside or at the FT line in the 2nd half, so there is scant evidence to chalk this up to lucky shooting - opponents are simply getting more opportunities to score, and are making more interior shots. The Hoyas' block and steal rate also drop between halves, again indicating that it is G'town that is performing differently in the second half, rather than just their opponents.


What is especially frustrating as a Hoyas fan is that the team is better than their opponent, on average, in the first half. In fact, Georgetown has gone to the locker room down double-digits only twice during this stretch (-11 vs. Notre Dame & Duke); for whatever reason, Georgetown outscored each in the second half.

Sunday, February 8, 2009

Recap: Cincinnati 64, Georgetown 62 [OT]

Another busy weekend for me, so another numbers dump for the Hoyas.

One point I will make is that, once again, Georgetown's defensive evaporated in the 2nd half. This is something that SFHoya99 discussed over at HoyaTalk, and probably is the biggest culprit in what is turning into a lost season.


Joseph Silverman / The Washington Times
Georgetown coach John Thompson III pulled all five of his starters early in Saturday's game against Cincinnati.


Let's run the numbers:

TEMPO-FREE BOX SCORE

. Home Visitor
. GU Cincinnati
. 1st Half 2nd Half Total 1st Half 2nd Half Total
Pace 28 29 58

Effic. 92.8 96.0 94.8 74.9 114.7 97.8

eFG% 52.5 43.1 46.9 38.6 68.0 54.3
TO% 25.0 16.0 19.9 25.0 26.7 26.0
OR% 16.7 27.8 23.3 21.4 33.3 27.6
FT Rate 30.0 55.2 44.9 22.7 56.0 40.4

Assist Rate 55.6 63.6 60.0 62.5 71.4 68.2
Block Rate 14.3 6.2 10.0 0.0 10.0 5.9
Steal Rate 7.1 10.7 9.2 7.1 2.7 4.6

2FG% 42.9 40.0 41.2 50.0 50.0 50.0
3FG% 50.0 33.3 40.0 12.5 66.7 41.2
FT% 83.3 68.8 72.7 80.0 64.3 68.4


INDIVIDUAL NET POINTS STATS

GU Off Poss Individ Def Individ
Player Poss Used ORtg Pts Prod Poss DRtg Pts Allow Net Pts
Summers, DaJuan 53 10.4 69.1 7.2 50 106.3 10.6 -3.5
Wright, Chris 56 10.2 95.6 9.8 53 93.8 9.9 -0.2
Monroe, Greg 54 18.2 75.2 13.7 52 60.3 6.3 +7.4
Freeman, Austin 55 9.8 99.6 9.8 52 107.8 11.2 -1.4
Sapp, Jessie 10 1.0 0.0 0.0 9 92.3 1.7 -1.7
Mescheriakov, Nikita 42 2.9 156.6 4.5 39 74.6 5.8 -1.3
Clark, Jason 24 7.6 106.6 8.1 29 121.3 7.0 +1.0
Vaughn, Julian 12 0.9 200.0 1.9 13 142.1 3.7 -1.8
Sims, Henry 9 1.0 0.0 0.0 10 112.5 2.3 -2.3
Wattad, Omar 15 3.1 138.5 4.4 18 101.2 3.6 +0.7
TOTALS 66 65.2 90.9 59.3 65 95.6 62.2 -2.9

Cincinnati Off Poss Individ Def Individ
Player Poss Used ORtg Pts Prod Poss DRtg Pts Allow Net Pts
VAUGHN, Deonta 63 19.2 98.4 18.9 63 86.7 10.9 +8.0
DAVIS, Larry 46 6.7 109.6 7.4 50 96.1 9.6 -2.2
WILLIAMS, Mike 49 10.5 97.8 10.2 50 95.9 9.6 +0.7
BISHOP, Rashad 40 3.8 44.6 1.7 40 75.2 6.0 -4.3
TOYLOY, Steve 23 3.9 98.1 3.9 27 90.3 4.9 -1.0
DIXON, Dion 30 5.2 50.2 2.6 30 102.9 6.2 -3.6
MITCHELL, Alvin 32 4.0 138.3 5.5 31 85.5 5.3 +0.2
MCCLAIN, Anthony 4 2.0 0.0 0.0 3 66.7 0.4 -0.4
GATES, Yancy 38 8.3 119.5 9.9 36 94.9 6.8 +3.1
TOTALS 65 63.6 94.5 60.1 66 90.5 59.7 +0.4


HD BOX SCORE

Cincinnati vs GU
02/07/09 7:00 at Verizon Center
Final score: Cincinnati 64, GU 62

Cincinnati Min +/- Pts 2PM-A 3PM-A FTM-A FGA A Stl TO Blk OR DR PF
VAUGHN, Deonta 43:39 + 3 16/64 4- 8 1- 5 5- 5 13/45 6/17 1/63 6/63 0/33 1/27 8/31 2
DAVIS, Larry 32:59 + 1 11/48 1- 2 3- 5 0- 1 7/35 1/13 0/50 0/46 0/24 0/22 1/21 2
WILLIAMS, Mike 33:36 + 0 11/48 4- 7 0- 0 3- 4 7/35 0/13 0/50 2/49 0/28 3/21 4/28 1
BISHOP, Rashad 28:10 + 1 0/35 0- 0 0- 0 0- 0 0/28 4/11 1/40 3/40 0/20 0/18 2/19 2
TOYLOY, Steve 16:23 - 1 4/22 1- 2 0- 0 2- 2 2/14 0/ 7 0/27 1/23 1/17 0/ 6 1/16 2
DIXON, Dion 19:41 -11 2/19 1- 1 0- 3 0- 0 4/21 2/ 6 0/30 3/30 0/15 0/15 1/13 4
MITCHELL, Alvin 21:55 +14 9/42 0- 1 3- 4 0- 0 5/24 2/11 1/31 1/32 0/16 0/13 1/16 2
MCCLAIN, Anthony 02:17 - 2 0/ 0 0- 1 0- 0 0- 0 1/ 2 0/ 0 0/ 3 1/ 4 0/ 2 0/ 2 0/ 2 1
GATES, Yancy 26:20 + 5 11/42 4- 8 0- 0 3- 7 8/31 0/10 0/36 0/38 1/15 2/21 5/14 4
TOTALS 45:00 64 15-30 7-17 13-19 47 15/22 3/66 17/65 2/34 8/29 23/30 20
. 0.500 0.412 0.684 0.682 0.045 0.262 0.059 0.276 0.767

GU Min +/- Pts 2PM-A 3PM-A FTM-A FGA A Stl TO Blk OR DR PF
Summers, DaJuan 35:18 - 1 7/51 0- 3 2- 4 1- 2 7/42 1/14 0/50 3/53 1/21 2/29 5/17 4
Wright, Chris 36:56 + 0 9/51 2- 5 0- 2 5- 6 7/44 4/14 1/53 2/56 0/21 0/30 3/21 0
Monroe, Greg 35:54 + 4 13/49 4-12 0- 0 5- 8 12/42 2/11 5/52 3/54 1/23 2/29 4/23 2
Freeman, Austin 36:41 - 2 10/52 3- 7 0- 2 4- 4 9/42 1/14 0/52 1/55 0/24 1/27 1/23 1
Sapp, Jessie 06:29 - 4 0/ 4 0- 1 0- 0 0- 0 1/ 6 0/ 2 0/ 9 0/10 0/ 7 0/ 4 1/ 5 0
Mescheriakov, Nikita 26:00 +10 5/36 1- 1 1- 3 0- 0 4/29 2/ 8 0/39 0/42 0/16 1/21 0/19 4
Clark, Jason 19:53 - 9 9/27 3- 4 1- 1 0- 0 5/17 1/ 6 0/29 3/24 0/17 1/ 9 3/15 4
Vaughn, Julian 09:06 - 6 2/13 1- 1 0- 0 0- 0 1/ 7 0/ 4 0/13 0/12 1/ 7 0/ 3 2/ 6 0
Sims, Henry 06:38 - 2 0/ 9 0- 0 0- 0 0- 0 0/ 5 0/ 3 0/10 1/ 9 0/ 5 0/ 2 0/ 6 1
Wattad, Omar 12:05 + 0 7/18 0- 0 2- 3 1- 2 3/11 1/ 4 0/18 0/15 0/ 9 0/ 6 0/10 1
TOTALS 45:00 62 14-34 6-15 16-22 49 12/20 6/65 13/66 3/30 7/30 21/29 17
. 0.412 0.400 0.727 0.600 0.092 0.197 0.100 0.233 0.724

Efficiency: Cincinnati 0.985, GU 0.939
eFG%: Cincinnati 0.543, GU 0.469
Substitutions: Cincinnati 34, GU 34

2-pt Shot Selection:
Dunks: Cincinnati 0-0, GU 0-0
Layups/Tips: Cincinnati 6-10, GU 12-24
Jumpers: Cincinnati 9-20, GU 2-10

Fast break pts: Cincinnati 2 (0.039), GU 4 (0.087)
Seconds per off. poss: Cincinnati 22.1, GU 19.2

Friday, February 6, 2009

Updating the Big East Aerial

I'm still in the throes of an amazingly hectic schedule, but I thought I'd post some non-recap content to prove I'm still a contributing member of society.

First, some housekeeping:
  • Most of the stats on the upper right sidebar are now updated (all except individual net points, which isn't really conveying what I'd like, so I'll let that sit).
  • The Big East HD box score project has obviously fallen by the wayside. I'll try to get it rolling again this weekend, but I can't make any promises as I don't know what my schedule will look like more than a couple of days ahead.
  • I have promised some additional functionality in my play-by-play parsing program, but that will likely have to wait until the off-season due to my current amount of free time.
-------------------------------------------------------------------------------------------------

About a month ago I trotted out an aerial for all Big East teams, to take a look at where everyone ranked as the conference schedule got underway. I thought I'd update that graph with stats through yesterday (Feb. 5th) [click on graph to enlarge].


This graph, like most I produce, will take some explanation.
  • Adj. offensive and defensive efficiencies come from KenPom.com, and are through games played 5-Feb-09. These are the large circles that are also color coded. The old off. and def. efficiencies (from 31-Dec-08) are the small blue circles.
  • The team labels are next to their current marker, while the thin black line connects the label to the previous position. This allows one to judge the change over the last 5 weeks - the Hoyas have taken a precipitous decline in both offense and defense, Marquette had improved its offense while maintaining its defense, West Virginia had fallen off defensively while its offense has shown only a slight decrease.
  • A couple of teams have their old positions obscured: Syracuse from 12/31 is under G'town's current spot, and Rutgers from 12/31 is under S. Florida's current spot.
  • Note that the ordinate axis (defensive efficiency) is scaled backwards, from high to low, so that better defensive teams are at the top of the graph
  • I've color-coded the current team markers, from black to yellow, indicating the nominal Pythagorean Rating, using Rating = AOEff^11.5 / (AOEff^11.5 + ADEff^11.5)
  • The solid grey line is a sort of 1:1 line, indicating where a team would be equally capable at offense and defense. Teams to the left or above the line are better defensively, while teams below or to the right are better offensively.
  • The diagonal grey dotted lines are isopleths. Teams that are the approximately same distance from a line (e.g. Marquette and Villanova) should be equally good, although they may do so by different means (here, Marquette by offense, Villanova is equally good on both ends).

An important consideration here is that the isopleths can be a bit deceiving, since the scaling there is not linear - the difference in "goodness" of teams between the two upper right isopleths is much smaller than the difference between the two lower left isopleths. This is a result of the way the Pythagorean rankings are calculated. So, the most improved team over the last 5 weeks is S. Florida, rather than Marquette.

Here's a table for all teams' change in the ratings between 31-Dec and 5-Feb, in Pythagorean change (remember, Pomeroy's ratings scale 0-1):
Team            Rating    Change
South Florida 0.652 0.129
Marquette 0.935 0.030
Providence 0.793 0.007
Seton Hall 0.714 0.003
Villanova 0.941 0.003
Connecticut 0.977 0.002
Louisville 0.957 -0.008
Pittsburgh 0.969 -0.008
West Virginia 0.956 -0.029
Syracuse 0.905 -0.034
Rutgers 0.592 -0.044
St. John's 0.644 -0.054
Georgetown 0.936 -0.055
Notre Dame 0.860 -0.064
Cincinnati 0.798 -0.088
DePaul 0.430 -0.173

From the table, we can see that a number of teams have been holding steady the last 5 weeks (Providence, Louisville, etc.) with only S. Florida and Marquette making strong improvements. A number of teams have declined since December, and Georgetown's huge drop on the graph isn't nearly as severe in real terms (e.g. Notre Dame has declined more). DePaul is serving as a good example of a team where the bottom really has fallen out.

Tuesday, February 3, 2009

Recap: Georgetown 57, Rutgers 47

Hoyas win! Hoyas win! Hoyas win!

Sorry if that was too obvious, but Georgetown was able to turn the page on a woeful January with a ten-point win at the Verizon Center tonight.

Not to go all Sports Guy (or Ray Floriani) on you, but I'll be writing this recap while watching the replay on ESPN360 - I wasn't able to watch or listen live thanks to a crazy-insane schedule these days. And thanks to SFHoya99 for writing a couple of nice posts here while I struggle to keep up.


Thoughts after first TV timeout [GU 2, RU 2]:
- A. Freeman is drifting on his jump shot.
- C. Wright can get by his man at will, but then what?
- D. Summers is trying too hard (2 fouls).
- Rutgers turns the ball over frequently.

Thoughts after 2nd TV timeout [GU 11, RU 10]:
- Rutgers finds its outside shot [RU 2/5 3FG in the 1st half]
- N. Mescheriakov looks promising, with very good hustle
- A. Freeman creates offense by driving and passing (still misses a 3FG)
- Bob Wentzel tells us that JTIII has installed a precision offense at Georgetown that eschews offensive rebounds for outside shots (G'town was 8th nationally in Off. Reb % [40.2] in 2007). The Hoyas off. rebounding problems are personnel-driven, not scheme-driven.

Thoughts after 3rd TV timeout [GU 19, RU 14]:
- Mescheriakov misses a wide-open 3FG, which he has to take [G'town ended the 1st half 2/9 3FG].
- J. Vaughn commits a "venial sin" of fouling a 3FG shooter. Wentzel +1.
- Vaughn and Mescheriakov seem to play behind their man in the post on defense. Monroe fronts his man.
- Freeman generates more offense by driving then kicking to Clark for a 3FG [Freeman with 3 assists in the 1st half].
- The announcers point out that G'town has 3 freshmen and 2 sophomores on the court. With Summers sitting with 2 fouls, anytime Sapp needs a rest only frosh and sophs are available.
- Dare I say, free Henry Sims [Sims led the team in Net Pts. for the 1st half (+4.0)].

Thoughts after 4th TV timeout [GU 22, RU 16]:
- Georgetown had 3 shots blocked on one possession (2 on Wright, 1 on Sims) - I wonder how many the official scorer will record [three, it turns out].
- Rutgers with more turnovers (11 so far) [RU 38.8% TO Rate in the 1st half].
- Wright with another drive without a plan [Wright had only 1 TO in the 1st half].

Thoughts heading into the half [GU 27, RU 18]:
- Sims with a nice backdoor pass to Freeman, who is called for a charge. Was that the 1st backdoor pass of the game?
- Monroe ended the half with consecutive assists. He ended the half +13 (+/-), leading the Hoyas.
- I'd like to say that Georgetown played a great defensive half, but I think most of the credit comes from Rutgers [RU: 58.1 Off. Eff. in the 1st half].
- Georgetown ended the half with an off. eff. of 87.2 - not very good, but with Rutgers struggles it doesn't have to be.
- 30 possessions for the half, but it felt even slower.


2nd half, thoughts after 1st TV timeout [GU 35, RU 21]:
- J. Sapp bails out the offense with a 3FG with 1 sec left on the shot clock. A quiet 9 points so far for Sapp.
- Rutgers turns the ball over their first two possessions of this half.

2nd half, thoughts after 2nd TV timeout [GU 45, RU 26]:
- Clark and Mescheriakov hit back-to-back 3FGs, causing a Rutgers timeout. Georgetown has now shot 4/5 3FG to start the second half, and pulled ahead by 20. This kind of outside shooting cures many ills.
- This game is starting to put me to sleep.

2nd half, thought after 3rd TV timeout [GU 49, RU 36]:
- M. Rosario has decided to use most possessions now [38% Poss. Used this half].
- The losing streak may have left some scars. The Hoyas are up 49-29 and look depressed. Maybe they're just disinterested. Sparse crowd, too.
- Rosario with a 7-0 run by himself as Georgetown's offensive execution starts to get sloppy.

2nd half, thoughts after 4th TV timeout [GU 56, RU 42]:
- I realized during the break that G'town will score only 8 more points the rest of the way.
- Wright breakaway lay-up - six points left.
- Mescheriakov with a spin in the post - four points left.
- Freeman doesn't drift on a 3FG and it goes in. One point left.

End of the game thoughts [GU 57, RU 47]
- Last Hoya point by Wright at the FT line.
- Game over. Other than some hot outside shooting, the Hoyas looked listless in the 2nd half.
- Rutgers lost this game with tons of turnovers and poor shooting on 2FG (RU was 3/17 on 2FG jumpers).


Let's run the numbers:

TEMPO-FREE BOX SCORE

. Home Visitor
. GU Rutgers
. 1st Half 2nd Half Total 1st Half 2nd Half Total
Pace 30 30 61

Effic. 87.2 99.5 93.0 58.1 96.2 76.7

eFG% 37.9 67.5 50.0 36.8 52.0 45.5
TO% 16.2 29.8 22.8 38.8 29.8 34.3
OR% 38.1 16.7 30.3 14.3 35.7 25.0
FT Rate 31.0 30.0 30.6 26.3 12.0 18.2

Assist Rate 70.0 72.7 71.4 33.3 72.7 58.8
Block Rate 0.0 5.9 3.2 20.0 0.0 12.9
Steal Rate 22.6 13.3 17.9 3.2 16.6 9.8

2FG% 40.0 54.5 45.2 28.6 41.2 35.5
3FG% 22.2 55.6 38.9 40.0 50.0 46.2
FT% 55.6 50.0 53.3 80.0 100.0 87.5


INDIVIDUAL NET POINTS STATS

GU Off Poss Individ Def Individ
Player Poss Used ORtg Pts Prod Poss DRtg Pts Allow Net Pts
Summers, DaJuan 25 7.9 59.0 4.7 25 88.0 4.4 +0.3
Wright, Chris 47 7.6 88.7 6.7 49 75.1 7.4 -0.6
Monroe, Greg 53 11.7 103.1 12.0 53 43.8 4.6 +7.4
Freeman, Austin 49 8.0 86.6 6.9 48 74.8 7.2 -0.3
Sapp, Jessie 33 5.3 130.1 7.0 35 89.9 6.3 +0.7
Mescheriakov, Nikita 31 8.0 58.6 4.7 31 86.5 5.4 -0.7
Clark, Jason 30 3.8 123.3 4.7 30 59.1 3.5 +1.1
Vaughn, Julian 2 0.0 - 0.0 3 146.7 0.9 -0.9
Sims, Henry 21 3.7 147.9 5.5 22 83.0 3.7 +1.8
Wattad, Omar 9 2.0 0.0 0.0 9 34.3 0.6 -0.6
TOTALS 60 58.0 89.9 52.1 61 72.0 43.9 +8.2

Rutgers Off Poss Individ Def Individ
Player Poss Used ORtg Pts Prod Poss DRtg Pts Allow Net Pts
Echenique,Gregory 37 4.0 49.1 2.0 37 102.1 7.6 -5.6
Chandler, Corey 30 10.4 9.2 1.0 28 85.7 4.8 -3.8
Farmer, Anthony 45 7.5 110.9 8.3 46 86.2 7.9 +0.4
Rosario, Mike 54 19.3 80.5 15.5 53 92.3 9.8 +5.7
Ndiaye, Hamady 43 4.8 93.1 4.4 41 83.2 6.8 -2.4
Pettis,Earl 36 7.4 123.4 9.1 36 76.6 5.5 +3.6
Inman, J.R 19 2.2 22.0 0.5 18 116.8 4.2 -3.7
Kuhn, Mike 1 0.0 - 0.0 2 0.0 0.0 +0.0
Jackson, Patrick 0 0.0 - 0.0 0 95.0 0.0 +0.0
Coburn, Mike 17 2.6 49.7 1.3 15 104.7 3.1 -1.8
Griffin, Jaron 23 1.6 116.0 1.9 24 88.0 4.2 -2.3
TOTALS 61 59.8 73.5 44.0 60 89.9 54.0 -10.0


HD BOX SCORE

Rutgers vs GU
02/03/09 7:00 at Verizon Center
Final score: GU 57, Rutgers 47

Rutgers Min +/- Pts 2PM-A 3PM-A FTM-A FGA A Stl TO Blk OR DR PF
Echenique,Gregory 24:26 -19 2/19 1- 4 0- 0 0- 0 4/21 0/ 5 0/37 0/37 2/24 0/15 3/25 1
Chandler, Corey 19:27 - 8 0/18 0- 3 0- 0 0- 0 3/17 1/ 6 0/28 8/30 0/15 1/12 2/18 1
Farmer, Anthony 30:18 -11 7/32 2- 6 1- 2 0- 0 8/33 5/ 8 1/46 1/45 0/28 0/22 2/30 1
Rosario, Mike 34:25 -11 20/41 3- 9 4- 8 2- 2 17/40 1/ 8 2/53 5/54 1/29 1/25 2/29 2
Ndiaye, Hamady 28:17 + 4 7/38 2- 2 0- 0 3- 3 2/33 0/12 0/41 3/43 1/18 0/20 5/20 2
Pettis,Earl 23:46 - 3 8/33 3- 4 0- 0 2- 3 4/28 1/ 9 3/36 2/36 0/17 2/17 3/16 3
Inman, J.R 12:03 -11 0/11 0- 2 0- 0 0- 0 2/12 0/ 3 0/18 0/19 0/ 9 1/10 4/ 8 3
Kuhn, Mike 01:04 + 0 0/ 0 0- 0 0- 0 0- 0 0/ 2 0/ 0 0/ 2 0/ 1 0/ 0 0/ 2 0/ 1 0
Jackson, Patrick 00:04 - 1 0/ 0 0- 0 0- 0 0- 0 0/ 0 0/ 0 0/ 0 0/ 0 0/ 0 0/ 0 0/ 0 0
Coburn, Mike 11:00 + 3 0/17 0- 1 0- 0 0- 0 1/12 2/ 7 0/15 2/17 0/ 4 0/ 6 1/ 5 0
Griffin, Jaron 15:10 + 7 3/26 0- 0 1- 3 0- 0 3/22 0/10 0/24 0/23 0/11 0/11 1/13 2
TOTALS 40:00 47 11-31 6-13 7- 8 44 10/17 6/60 21/61 4/31 7/28 23/33 15
. 0.355 0.462 0.875 0.588 0.100 0.344 0.129 0.250 0.697

GU Min +/- Pts 2PM-A 3PM-A FTM-A FGA A Stl TO Blk OR DR PF
Summers, DaJuan 16:41 - 3 5/22 1- 3 1- 3 0- 0 6/20 1/ 6 1/25 3/25 0/14 1/15 2/10 3
Wright, Chris 31:55 + 8 5/45 2- 7 0- 2 1- 2 9/38 3/14 2/49 1/47 0/27 1/26 0/21 1
Monroe, Greg 34:44 +20 10/53 4- 8 0- 0 2- 5 8/45 6/16 4/53 2/53 0/27 1/29 6/26 0
Freeman, Austin 32:21 + 7 7/45 1- 3 1- 3 2- 2 6/41 3/14 1/48 2/49 0/23 0/28 4/21 2
Sapp, Jessie 21:57 + 1 11/32 2- 3 2- 2 1- 2 5/30 0/ 9 0/35 1/33 0/17 1/19 3/15 1
Mescheriakov, Nikita 20:03 + 1 7/27 2- 2 1- 5 0- 0 7/23 0/ 7 1/31 2/31 0/17 0/14 0/15 5
Clark, Jason 20:22 + 6 6/29 0- 0 2- 3 0- 0 3/22 2/ 9 2/30 2/30 1/17 1/15 2/17 1
Vaughn, Julian 01:52 - 4 0/ 0 0- 0 0- 0 0- 0 0/ 1 0/ 0 0/ 3 0/ 2 0/ 1 0/ 1 0/ 1 2
Sims, Henry 13:58 + 3 6/19 2- 4 0- 0 2- 4 4/17 0/ 4 0/22 0/21 0/ 8 2/13 1/ 8 1
Wattad, Omar 06:07 +11 0/13 0- 1 0- 0 0- 0 1/ 8 0/ 5 0/ 9 1/ 9 0/ 4 0/ 5 0/ 6 0
TOTALS 40:00 57 14-31 7-18 8-15 49 15/21 11/61 14/60 1/31 10/33 21/28 16
. 0.452 0.389 0.533 0.714 0.180 0.233 0.032 0.303 0.750

Efficiency: GU 0.950, Rutgers 0.770
eFG%: GU 0.500, Rutgers 0.455
Substitutions: GU 27, Rutgers 27

2-pt Shot Selection:
Dunks: GU 0-0, Rutgers 2-2
Layups/Tips: GU 11-21, Rutgers 6-12
Jumpers: GU 3-10, Rutgers 3-17

Fast break pts: GU 2 (0.041), Rutgers 4 (0.100)
Seconds per off. poss: GU 20.3, Rutgers 20.0