Friday, November 13, 2009

Recap: Georgetown 74, Tulane 58

The Hoyas tipped off the 2009-10 season in style tonight, shaking off last season's disappointment and a likely food-coma to pull away from the might Green Wave in the second half.

It's a little strange firing up the HD Box score program after the long off-season and sitting down to write a recap. Forgive some rust.

Let's run the numbers:

TEMPO-FREE BOX SCORE

.            Visitor                         Home  
.            Georgetown                      Tulane     
.            1st Half  2nd Half   Total      1st Half  2nd Half   Total
Pace            31        34        65

Effic.        104.7     123.2     114.1        88.3      90.9      89.4

eFG%           51.9      67.3      59.4        42.9      47.6      44.9
TO%            29.4      17.6      23.1        19.6      20.5      20.0
OR%            50.0      30.8      41.4        33.3      14.3      25.0
FT Rate        22.2      46.2      34.0        17.9      76.2      42.9

Assist Rate    50.0      68.8      60.7        72.7      44.4      60.0
Block Rate     17.6       7.1      12.9        11.8      10.5      11.1
Steal Rate      9.8      11.7      10.8        16.4       8.8      12.3

2FG%           47.1      68.4      58.3        52.9      50.0      51.6
3FG%           40.0      42.9      41.2        18.2      28.6      22.2
FT%            66.7      58.3      61.1        60.0      68.8      66.7

There were 64 possessions in the game, with a faster pace in the second half - I think the extra possessions in the Vesper half were accumulated during garbage time in the last five minutes or so.

For those of us watching the Tulane video stream (or at least parts), there was a noticeable improvement in the Hoyas play in the second half, not just the pace - this came on the offensive end, as the Hoyas posted nearly identical defensive efficiencies in both halves of the game.

The Hoyas seemed to come out with some jitters early in the game, most apparent in Chris Wright's four turnovers in the half (9 total for the team). This lead to a disappointingly high TO rate, but the team managed "only" six second half turnovers - none by Wright as they got their sea legs after 20 minutes of play.

The team rebounded well against undersized Tulane, with a strong offensive rebounding performance in the 1st half and excellent defensive rebounding in the 2nd.

The team also shot well from the outside, making ≥40% from deep in each half. That uptick in 2FG shooting in the second half may have been at least partially the result of the strong 3FG shooting, which seemed to open up the interior as the Green Wave defenders were forced to guard out to the arc. Outside shooting is going to be a critical item to watch as the season unfolds, as it serves to open up the cutting lanes.

Tulane probably scored a few more points that you'd have expected from the underlying stats, simply because they made a high percentage of 2-pt jumpers (10/16). The Hoyas did a good job forcing more 2-pt jump shots than layup and dunk attempts, but sometimes you run into a hot-shooting team. Thankfully, Georgetown was dominant in most other facets.


INDIVIDUAL NET POINTS STATS

Georgetown            Off     %           Pts      Def           Pts   
Player                Poss  Poss  O.Rtg   Prod     Poss  D.Rtg  Allow    Net Pts
Vaughn, Julian         34   21.5  138.8   10.2      35    90.1    6.3      +3.7  
Monroe, Greg           57   25.7  121.5   17.8      58    87.6   10.2      +6.3  
Wright, Chris          57   15.8   98.6    8.9      57    70.1    8.0      +1.7  
Freeman, Austin        53   22.6  110.7   13.2      51    77.0    7.9      +4.7  
Clark, Jason           55   16.0  134.1   11.8      53    75.0    8.0      +4.5  
Thompson, Hollis       25   15.4   44.5    1.7      26   107.2    5.6      -3.1  
Mescheriakov, Nikita    5   20.0    0.0    0.0       6   166.7    2.0      -1.8  
Sanford, Vee            2    0.0    -      0.0       3   200.0    1.2      -1.2  
Benimon, Jerrelle       2    0.0    -      0.0       2   250.0    1.0      -1.0  
Sims, Henry            30   20.9  122.0    7.6      29   103.0    6.0      +1.4  
TOTALS                 64         113.3   71.2      64    87.5   56.0     +15.9  

Tulane                Off     %           Pts      Def           Pts   
Player                Poss  Poss  O.Rtg   Prod     Poss  D.Rtg  Allow    Net Pts
MCQUEEN, Asim          49   17.8   73.0    6.4      48   112.5   10.8      -3.9  
HOLMES, Aaron          45   17.0   95.6    7.3      47   114.4   10.8      -2.4  
HOGAN, Geoff           24   10.4  115.0    2.9      23   114.0    5.2      -1.2  
RICHARD, Kris          57   24.1  101.9   14.0      56   116.6   13.1      -0.5  
SIMS, Kevin            54   13.9   53.9    4.0      53   123.0   13.0      -7.1  
BOOKER, David          44   24.8  102.4   11.2      46    99.6    9.2      +1.2  
ROGERS, Trent          12   46.1   56.7    3.1      13   112.3    2.9      -1.4  
TIMMONS, Kendall       13    1.8  225.0    0.5      13   103.1    2.7      -0.9  
MAYHANE, Johnny        15   25.5  117.3    4.5      15    86.7    2.6      +1.5  
VIANNEY, Eric           7   20.0   57.1    0.8       6    53.8    0.6      +0.1  
TOTALS                 64          88.2   54.7      64   110.8   70.9     -15.3  

The individual net points stats show the story, with the returning players (except Mescheriakov) all coming out strong. Wright just missed joining five teammates with a +100 offensive rating for the game (one less turnover would have done it), but made up for it with the top rated defense in the game - 5 steals will go a long way towards making amends.

Julian Vaughn posted a particularly strong opening night, thanks in no small part to 4 offensive rebounds grabbed on only 17 opportunities. I had mentioned in his season preview article that he seems to have a talent for offensive rebounding, and if he can keep that rate up he'll make it awfully difficult for Henry Sims to displace him from the starting line-up.

Clark (3/6 3FG), Sims (2/2 2FG, 2 OR) and Freeman (4/6 2FG, 2/3 3FG) all looked at mid-season comfort. Hollis Thompson did not, appearing a bit passive throughout the game. That was to be expected for his first collegiate game, and I'll expect it will take most of the fall semester for Thompson to grow comfortable in game situations.

The player of the game was . . . Greg Monroe, making his triumphant return to his home town. While not a spectacular game by his standards, Monroe looked comfortable stepping up to use 25% of available possessions while keeping a high efficiency and playing his typical strong defense (2 blocks, 8 DR). I hope his family and friends had a great time watching him play in person.


HD BOX SCORE

Georgetown vs Tulane
11/13/09 8:15 p.m. at Fogelman Arena, New Orleans, LA
Final score: Georgetown 74, Tulane 58

Georgetown              Min   +/-   Pts  2PM-A 3PM-A FTM-A  FGA    A    Stl    TO   Blk    OR    DR   PF
Vaughn, Julian         24:02  +14   7/43  2- 5  1- 1  0- 2  6/31  2/13  0/35  1/34  2/20  4/17  1/24   2
Monroe, Greg           35:25  +16  18/66  7-12  0- 2  4- 6 14/48  2/18  0/58  1/57  2/29  3/27  8/30   2
Wright, Chris          35:24  +17  11/66  4- 7  1- 3  0- 0 10/48  2/20  5/57  4/57  0/29  0/27  2/29   1
Freeman, Austin        32:03  +23  16/66  4- 6  2- 3  2- 2  9/43  5/19  1/51  4/53  0/27  0/21  6/28   4
Clark, Jason           34:35  +27  13/68  1- 2  3- 6  2- 2  8/45  5/21  1/53  2/55  0/27  0/23  4/30   3
Thompson, Hollis       16:07  - 5   2/24  1- 2  0- 2  0- 0  4/22  1/ 8  0/26  1/25  0/11  0/15  1/ 8   3
Mescheriakov, Nikita   03:25  - 8   0/ 2  0- 0  0- 0  0- 0  0/ 6  0/ 1  0/ 6  1/ 5  0/ 2  0/ 5  0/ 1   2
Sanford, Vee           01:15  - 6   0/ 0  0- 0  0- 0  0- 0  0/ 1  0/ 0  0/ 3  0/ 2  0/ 0  0/ 1  0/ 1   0
Benimon, Jerrelle      01:14  - 5   0/ 0  0- 0  0- 0  0- 0  0/ 1  0/ 0  0/ 2  0/ 2  0/ 0  0/ 1  0/ 0   0
Sims, Henry            16:30  + 7   7/35  2- 2  0- 0  3- 6  2/20  0/12  0/29  1/30  0/10  2/ 8  2/ 9   1
TOTALS                 40:00       74    21-36  7-17 11-18    53 17/28  7/64 15/64  4/31 12/29 24/32  18
.                                        0.583 0.412 0.611       0.607 0.109 0.234 0.129 0.414 0.750   

Tulane                  Min   +/-   Pts  2PM-A 3PM-A FTM-A  FGA    A    Stl    TO   Blk    OR    DR   PF
MCQUEEN, Asim          29:27  -10   7/47  3- 9  0- 0  1- 2  9/39  0/14  1/48  0/49  0/28  1/23  0/21   3
HOLMES, Aaron          19:27  -24   8/36  2- 5  0- 1  4- 8  6/36  0/ 9  2/47  1/45  2/23  1/28  2/18   0
HOGAN, Geoff           04:51  - 7   2/18  0- 1  0- 0  2- 2  1/15  1/ 4  0/23  0/24  0/ 9  1/13  1/ 9   3
RICHARD, Kris          34:10  -10  15/53  4- 5  1- 7  4- 4 12/41  1/13  0/56  1/57  1/32  1/25  3/25   4
SIMS, Kevin            33:16  -13   3/49  0- 2  0- 4  3- 3  6/43  3/16  0/53  3/54  0/27  0/30  1/24   0
BOOKER, David          28:32  -13  14/43  4- 6  2- 2  0- 2  8/35  2/ 9  3/46  3/44  1/27  2/23  7/20   4
ROGERS, Trent          08:20  - 2   4/13  2- 2  0- 1  0- 0  3/10  1/ 4  0/13  3/12  0/10  0/ 5  1/ 8   1
TIMMONS, Kendall       08:31  - 5   0/ 9  0- 0  0- 0  0- 0  0/ 9  1/ 4  0/13  0/13  0/ 9  0/ 5  0/ 8   2
MAYHANE, Johnny        09:19  - 2   5/14  1- 1  1- 2  0- 0  3/11  2/ 3  2/15  1/15  0/10  0/ 6  0/ 7   0
VIANNEY, Eric          04:37  + 6   0/ 8  0- 0  0- 1  0- 0  1/ 6  1/ 4  0/ 6  0/ 7  0/ 5  0/ 2  0/ 5   0
TOTALS                 36:06       58    16-31  4-18 14-21    49 12/20  8/64 13/64  4/36  8/32 17/29  17
.                                        0.516 0.222 0.667       0.600 0.125 0.203 0.111 0.250 0.586   

Efficiency: Georgetown 1.156, Tulane 0.906
eFG%: Georgetown 0.594, Tulane 0.449
Substitutions: Georgetown 26, Tulane 28

2-pt Shot Selection:
Dunks: Georgetown 3-3, Tulane 1-1
Layups/Tips: Georgetown 12-18, Tulane 5-14
Jumpers: Georgetown 6-15, Tulane 10-16

Fast break pts (% FG pts): Georgetown 7 (11.1), Tulane 8 (18.2)
Pts (eff.) after steal: Georgetown 10 (142.9), Tulane 9 (112.5)
Seconds per poss: Georgetown 17.8, Tulane 20.1

Season Preview: Julian Vaugn and Jerrelle Benimon

There was a constant clamoring heard over the off-season, several variations on a theme:
". . . but if the Hoyas hope to return to the top of the Big East, they will need to do a better job on the boards."

Julian Vaughn will have to be a strong rebounder and hang on to the ball to get major minutes this year.

Jerelle Benimon can earn some minutes if he can play strong defense and grab some rebounds.


Let's take a look at each of these statements (I only made two of them up), one at a time.


Measuring Rebounding and It's Importance

Rebounding has been a topic of great concern here, and all over Hoya nation. But before I jump headlong into the charts and tables, I thought I'd review some of the basics we've covered here.

When we discuss rebounding, we like to talk about rebounding percentages, rather than raw rebounding totals or the slighly more sophisticated rebounding margin (tot. rebounds - opp. tot. rebounds).

Why? Let me re-post a brief explanation Alan provided last season:
The most commonly used measure of rebounding is rebounding margin. There's a number of problems with this:
  • Rebounding margin mixes offensive and defensive rebounding. Rebounding margin nets offensive and defensive rebounds for both teams, but the problem is that offensive and defensive rebounding are related, but different skill sets. Good offensive rebounding tends to be the result of strong individual effort. Defensive rebounding is much more of a team effort because it is much more highly dependent on all players establishing proper position. Good offensive rebounders often rely more on athleticism; defensive rebounders on position. More importantly, players rebounding on defense have positional advantage -- and rebounding margin doesn't account for that.
  • Rebounding margin fails to compensate for differences in opportunity. There's an opportunity for a rebound on every missed shot. But not every possession ends on a missed shot. Some end on a made shot; some on a turnover. Since a team is more likely to get a defensive rebound than an offensive one, rebounding margin can make a team appear worse or better than it is simply because a team has more offensive opportunities than defensive or vice versa. For example, a team that forces a ton of turnovers will have less defensive rebounding opportunities and a lower rebounding margin than you'd expect. (Georgetown under Thompson would actually have an inflated rebounding margin over the years -- a negative turnover margin and better shooting than opponents means many more defensive rebounding opportunities).
  • Rebounding margin fails to account for pace. More possessions means more opportunities for rebounds. This will not make a good rebounding team look poor, but a faster pace will make a good rebounding team look even better under rebounding margin.
A much better statistic is rebounding percentage. It is simply the number of rebounds a team gathers divided by their opportunities to grab a rebound. It is split into offensive and defensive rebounding percentage so as to avoid the problems of rebounding margin.

Last season, Georgetown's defensive efficiency slumped in conference, as the team finished the Big East regular season allowing 1.03 points per possession, the most since 2004-5. This was often attributed to poor defensive rebounding, allowing many second-chance points (think Pitt or St. John's).

Here are the team's defensive efficiencies and defensive rebounding percentages for the past five seasons:
Year        D.Eff.   Rank       DReb%    Rank
2004-5      105.2     8*        62.9       6*
2005-6      101.9     6         67.2       3
2006-7       97.3     4         63.1      13
2007-8       92.4     2         66.8     t-6
2008-9      103.1     7         63.2      12

*There were 12 teams in the Big East in 2004-5, 16 teams in the following seasons; all data from StatSheet.com

The Hoyas have only been among the league leaders in defensive rebounding once in the past five seasons, and that year (2005-6) was not a particularly strong defensive year. Indeed, while the team struggled to rebound defensively in 2006-7, the defense as a whole showed a strong improvement over the previous season, and the outstanding defensive team the next season were only middling defensive rebounders.

Of course, rebounding doesn't exist in a vacuum but is a component of overall team play. In fact, it is one component of what we call the Four Factors, first named and described by Dean Oliver. Oliver hit open the concept when he realized that each possession will end one of four ways (here from the defensive perspective):
  • a made field goal (opp. eFG%)
  • a missed shot rebounded by the defense (D. Reb. %)
  • a turnover (opp. TO Rate)
  • a foul resulting in free throws (FT Rate)
If you account for these four factors when looking at a box score or season recap, you'll have a fairly good idea of what went well and what did not. Moreover, since rebounding is only a component of total team defense, some context must be considered when looking at rebounding percentages.

For example, Syracuse is normally a mediocre to poor defensive rebounding team, averaging 63.5% Def. Reb. over the past five seasons while playing above-average defense in four of those five years. Of course, Jim Boeheim's squads primarily play a zone defense, which eschews strong defensive rebounding for low shooting percentages allowed and few fouls committed.


Let's return to the table above, but fill in all four of the factors for each season:
Year      D.Eff.  Rank     DeFG%  Rank    DTO%  Rank    DReb%  Rank    FTRate Rank
2004-5    105.2     8      48.5     8     20.4    6     62.9     6      37.5    8
2005-6    101.9     6      48.9     9     19.3    7     67.2     3      26.4    4
2006-7     97.3     4      45.2     3     20.9    8     63.1    13      28.1    1
2007-8     92.4     2      41.8     1     20.3    7     66.8   t-6      39.8   12
2008-9    103.1     7      49.2   t-8     21.0    5     63.2    12      37.1   11

All data from StatSheet.com

Hopefully the first thing that jumps out is that the biggest driver of defensive efficiency is opponent's eFG% - if the other team isn't making shots, they're going to have a hard time scoring.

But we're here to talking about rebounding, so let's take a look at each season:
  • 2004-5: The team was pedestrian across the board (remember, this was the old, 12-team Big East, so a ranking of 6 is just average). The one thing I did notice was that the league average defensive rebounding rate was only 63.2%, which seems especially low. Perhaps most of the teams in the old league favored zone?
  • 2005-6: The Hoyas had an odd combination of strong defensive rebounding (a man-to-man trait) and few fouls committed (a zone trait). Along with the the poor shooting defense and few turnovers forced, this looks like a tall but defensively passive team (likely due to the short bench). Here, the strong rebounding was undoubtedly important - there is a substantial improvement defensively despite worse shooting defense and few turnovers forced.
  • 2006-7: Georgetown's profile is very different here, much more like the zone-defense team that we discussed earlier. This team rebounded just as poorly as last year's club, but were able to ride their famous offense and an under-rated defense to the Final Four. This season shows clearly that, if a team defends shots well along with one other factor (here, committing very few fouls), that team can play stout defense - even if they give up a lot of second shots.
  • 2007-8: And here, the lesson is simple - defend shooters better than any else has in the past five years, and everything else will just take care of itself. Obviously the Hoyas improved on the defensive glass, but that ridiculous shooting defense was the real story [UConn has the 2nd - 5th spots in def. eFG% over the past five years]. Indeed, in the infamous Davidson game, it wasn't the rebounding that failed the team, but a lack of turnovers and a complete inability to defend 2-pt FGs that doomed Georgetown in the second half. The pattern here - good rebounding, lots of fouls - smacks of a team playing mostly half-court man-to-man, and looks to have been a sharp change from 2006-7.
  • 2008-9: Boy, the wheels sure came off that sucker. One reason I made sure to add rank next to each column is because the Big East's overall offensive (or defensive) efficiency varies from year-to-year: 2008-9 was the highest scoring in the past five seasons, at 1.041 points per possession, after 1.027 ppp the previous year. So despite the large uptick in def. efficiency, the Hoyas were actually better than average (or median) defensively in conference. The increase in forced turnovers and still high fouls indicates a bit more pressing by the defense, but the poor shooting defense was too big a handicap to overcome. If we compare last year to 2005-6 and call the differences in TO Rate and FT Rate a wash, the poor defensive rebounding last year looks to have cost the Hoyas about 1 point of defensive efficiency.

Is 1 point of defensive efficiency significant, especially when the typical spread in the conference is about 20 points? Well, it certainly could be when a team is seemingly winning most lopsided games but losing most close ones, and the Hoyas did in conference last season.

Returning to a previous post on luck (as defined by the difference between actual and expected wins), we can actually just plug in that 1 point less defensive efficiency (about 0.6 points per game) and see what it's worth: ~0.4 wins. Not as much as you may have expected - if you want to round up and just call it one more win in conference play, would that have been enough to get the Hoyas on (or even over the bubble)? I'll leave that conjecture for others.


A quick bit on offensive rebounding

Throughout the discussion above, I've been entirely concerned with defensive rebounding. As Alan noted in the section I co-opted from him, offensive and defensive rebounding rates don't necessarily correlate, since they depend upon complementary, not identical, skills and in part on the head coach's game strategy.

How have the Hoyas rebounded offensively the past five seasons?

Year        DReb%    Rank     OReb%   Rank     TReb%   Rank
2004-5      62.9       6       33.5     9       48.2     9
2005-6      67.2       3       38.1     4       52.7     4
2006-7      63.1      13       41.3     2       52.2     4
2007-8      66.8     t-6       31.7    12       49.3    12
2008-9      63.2      12       33.7    12       48.5  t-13

all data from StatSheet.com

Georgetown's best offensive rebounding season (2006-7) was also one of their worst for defensive rebounding. More to the point, despite losing 7'2" Roy Hibbert, 6' 9" Vernon Macklin and 6' 8" Patrick Ewing Jr., last season's team - while no great shakes - actually was a better offensive rebounding club that the 2007-8 team.

I've also included total rebounding percentage [= (OReb% + DReb%)/2] in the table, and this final stat likely jibes better with common perception. Georgetown was not historically bad in either offensive or defensive rebounding last season, but by performing poorly in both the team's total rebounding rate ranked as low as any JTIII-team.

I do wonder though, if the two strong rebounding seasons (Hibbert's sophomore and junior years) may eventually prove the aberration for the 21st-century Hoyas.


Julian Vaughn will be asked to shore up the Hoyas' meager rebounding this season. To understand whether he can help, we'll need to ask how well has Vaughn rebounded in the past, who will he replace, and can we expect an improvement season-over-season.

How well has Julian Vaughn rebounded his first two seasons?
Year       %Min      OReb%      DReb%
Frosh      29.6      10.8       10.2
Soph       21.5      11.1       10.2
I don't have access to conf. only stats for Julian his freshman year at Florida St., so I'll be using full season stats in this section.

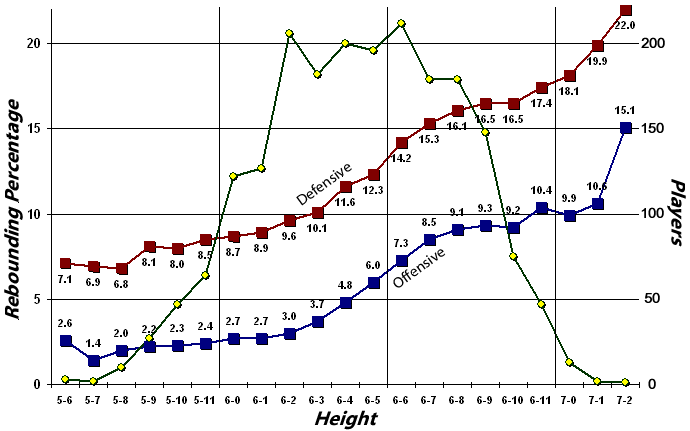
Okay, we have some numbers, but can we give them some context? Thankfully, Ken Pomeroy has provided us with a very handy chart, showing average rebounding percentage as a function of height for all college players (click on any figure to enlarge):


Julian Vaughn's height is listed as 6'9" by Georgetown (he was listed at 6'10" at Florida St. [.pdf], so either he is shrinking or the Seminoles may be cooking the books). For the average 6'9" Div. I player, we'd expect an OReb% = 9.3 and a DReb% = 16.5.

From the chart, Vaughn is an above average offensive rebounder, but a suprisingly below-par defensive rebounder. In fact, in each of his first two campaigns, Vaughn was more likely to get an offensive rebound than a defensive one.


Who will Vaughn be replacing?

The primary additional minutes Vaughn will get this year were used by DaJuan Summers last season. To put this bluntly, those minutes will not be hard to replace, at least from a rebounding perspective. Summers' number last season (OReb% = 5.5, DReb% = 11.7) were underwhelming, both as the nominal power forward for the Hoyas, and as a 6'8" college player.

Vaughn looks to have the skill set to greatly improve Georgetown's offensive rebounding this year, but probably won't be able to help much on the defensive glass outside of Greg Monroe (OReb% = 9.0, DReb% = 16.6).

When Vaughn isn't on the floor this year, he'll likely be subbed for by Henry Sims (OReb% = 7.0, DReb% = 12.7), who represents an incremental upgrade from Summers, but not much more.


Will Vaughn be a better rebounder this year?

This seems to be the most intuitive step that I've not addressed - as players get older and stronger, they should be able to out-compete younger players for rebounds, and therefore we'd expect a returning player (e.g. Julian Vaughn) to likely be a better rebounder this year.

That assumption is easy enough to check. Below I've plotted year-over-year defensive and offensive rebounding stats for Big East players from 2005-2008:


A quick explanation
  • The x-axis is a player's rebounding rate for a given season, while the y-axis is that player's rebounding rate the following season.
  • The markers are sized by player's % minutes played (>10% minutes both years to qualify) and colored by player height.
  • The black line is a linear fit to the data, weighted by player minutes.
  • The gray lines are the 95% prediction bands - 95% of the markers should be within these lines.
  • The blue line is the 1:1 line - players that fall along the line performed at the same level both seasons.
The takeaways here are several: the fitted line of defensive rebounding is above the 1:1 line up to about 16%, indicating that defensive rebounders tend to improve year-over-year up to about this point. But the difference from year-to-year is very small, certainly less than 1% change on average. For offensive rebounding, the fitted is below the 1:1 line above about 5%, which implies that those players who are strong offensive rebounders (>5%) do not, in fact, improve from one year to the next. Most importantly, the majority of the data is well-scattered about the 1:1 line, especially defensive rebounding. Therefore, most of the change from one year to the next is just statistical noise, and that players, on average, rebound at the same level each season. That is, rebounding ability (or desire) is fully formed when the players arrive in the Big East from high school.

So the results are mixed for Julian Vaughn. Statistically, if there's any change we'd expect a small improvement in defensive rebounding and a small decline in offensive rebounding.

More likely, what we've previously seen from Vaughn (and Sims) just may be what we can hope for during this season.


Can Jerrelle Benimon help?

A complete unknown coming into this season is Jerrelle Benimon, a player few are expecting to contribute significant minutes this year. Could Benimon be some sort of stealth rebounding freak? Possibly, but we have no way of knowing right now, and no mention of such prowess was made during Kenner League.

What we do know is that he is 6'7" and 242 lbs. From Ken Pomeroy's chart above, we can see that 6' 7" players are part of the upper plateau for defensive rebounding, on average garnering 15.3% of defensive rebounds. So Benimon certainly has the right body-type for rebounding.

But, as we saw near the top, defensive rebounding can be an overvalued stat for overall team defense, and I'd like to see his full skill set before I suggest he should be taking minutes from Vaughn or Sims.

2009-10 Season starts today!

And just like that, another Georgetown basketball season is upon us. The Hoyas are down in New Orleans to take on the Tulane Green Wave (Waves?) tonight.

We don't have much in the way of a game preview, and since we won't be able to watch the game probably won't have much of a recap other than a stats dump.

Speaking of dumps, here's a blogosphere link dump for your pre-game hype:
We'll continue the interminable season preview with a look at rebounding and Julian Vaughn later today. At this rate, we should be finished previewing the season some time in December.

Tuesday, November 10, 2009

Season Preview: Hollis Thompson

Hollis Thompson isn’t likely to be the best player on the Hoyas. He isn’t likely to be the most important player, either, if you are one of those folks who separate “best” from “most valuable.” However, to an outsider at least, Hollis Thompson is likely the Hoya with the widest range of reasonable expectations for performance this year.

The green-shirt freshman was originally slated to graduate from high school at the end of the 2008-09 school year. A lanky, 6’8” small forward out of Southern California, Thompson was ranked 27th in the RSCI [Recruiting Service Consensus Index] heading into his senior season of high school and was particularly known for his ability to shoot and score.

Due to personal circumstances, Hollis decided to graduate from high school in December and enroll early at Georgetown. Despite the fact that this could only help Thompson – getting college coaching early – his recruiting ranking slipped and he ended up at 76 in the RSCI, due mainly to some recruiting experts dropping him off their Top 100 lists completely, presumably because they no longer considered him a recruit.

Two major contributors from last year, DaJuan Summers and Jessie Sapp, are gone from this year’s team. The Hoyas also played a three guard lineup last year primarily because the team’s power forwards were ineffective. This lineup was not always effective, especially on defense. Summers was the team’s only above average "true" small forward, and he is in the NBA.

There’s room in the rotation for Hollis Thompson.


What are the chances that Thompson is a significant contributor this year? What can the Hoyas expect in terms of production?

We can get an idea of the answer to both those questions by looking at freshmen under John Thompson III at Georgetown.

Playing Time
.                                 # (%) played   # (%) played
Player Group total >10 mpg >20 mpg

All recruited frosh 17 9 (53%) 6 (35%)
RSCI-ranked freshmen 6 4 (67%) 3 (50%)
*The data set excludes Chris Wright, who was injured much of his freshman year, and Nikita Mescheriakov, who red-shirted.


Coach Thompson has had 17 freshmen who were able to play for the majority of their freshman year, and about half of them contributed at a backup level at the minimum. About a third played over 20 mpg, about starter level or strong sixth man.

The fact that Hollis Thomspon is a highly recruited player makes his chances of being a contributor even stronger – 2/3 of RSCI freshmen contribute and half have seized major rotation minutes during their freshman year.

Of course, we know more about Hollis than the average freshman. Between Kenner League performances and JTIII’s commentary, it seems safe to say that his chances of breaking 10 mpg barrier are stronger than 67%.

With this year's short roster, we can also take a fairly educated guess about the Hoyas’ likely rotation this year. Don’t pay too much attention to any one player’s estimate. The takeaway is that, once you exclude Thompson from playing power forward or center and account for a healthy increase in playing time for Jason Clark, there’s about 30 minutes available at either guard or small forward.
Player         Est mpg     Min. Left
. 200
Monroe 32 168
Wright 31 137
Freeman 30 107
Clark 27 80
Sims 23 57
Vaughn 23 34
Mescheriakov/
Benimon as PF 4 30

Mesch. as SF ?
Sanford ?
Thompson ?

So there’s potential for Hollis to take a very significant role. The RSCI-ranked Hoya freshmen play 20 mpg or more about 50% of the time, and that seem about right for Thompson. There are thirty minutes available, but Sanford has been drawing strong review and Mescheriakov played 17 mpg in conference play last year. In other words, Thompson is simply going to have to be better than the competition. That’s been something of a mixed bag, even with ranked freshmen.


If he does get playing time, how good is Thompson likely to be? Will Hollis be able to match or improve upon the player whose minutes and possessions he will be asked to take?

Below is a table comparing DaJuan Summers’ junior year, and three possible bases for projection:
  • DaJuan Summers’ freshman year (the most obvious single player comparison for Thompson)
  • the weighted average of all Hoya freshman years under JTIII
  • the weighted average years of those freshmen who were ranked in the RSCI.

Player
Year mpg %Poss %Shot ORat FG% TS% 3FG% OReb% DReb% ARate TORate

DaJuan Summers, 08-09 29 25 25 104 47 60 39 5 12 10 22
Jessie Sapp, 08-09 25 16 18 101 37 51 38 6 11 13 22
N. Mescheriakov, 08-09 14 15 16 83 34 45 26 5 8 8 28

DaJuan Summers, 06-07 26 22 22 102 41 54 33 9 9 8 24

All Recruited Hoya
Freshmen 24 19 18 103 47 56 30 7 12 13 24
RSCI Ranked Frosh 24 20 19 108 51 59 31 8 12 12 23
*Stats weighted by minutes per game in order to get an approximation of what Hollis Thomspon might produce if he is good enough to get substantial minutes.

While Hollis is a small forward and thus, from a positional perspective, will be the receipient of Sapp's and potentially Mescheriakov's minutes, his offensive role will be much more like Summers'. In addition, neither of Summers' positional replacements had a possession % north of 15% last year, meaning that from an offensive standpoint, they simply will not use anything close to Summers' number of possessions.

What this means is that I'm mostly comparing Hollis' potential contribution to Summers.

The Encouraging
  • The average Hoya Freshman’s offensive rating is not all that different than Summers’ as a junior, and Summers was the most effective offensive player of the three listed above. RSCI-ranked freshmen were substantially better on a per-possession basis.

  • Freshmen generally don’t take as significant a role in the offense as Summers did. Normally this is not necessarily a good thing; this year it is. Those 3% - 7% of shots and possessions that Hollis is unlikely to take will hopefully go to Monroe, Wright or Freeman.

  • While estimating rebounding by averaging a slew of different positions may be a bit suspect here (are the freshman years of Greg Monroe or Jon Wallace really useful for projecting Hollis Thompson?), I’m inclined to let the projection stand as Hollis is playing the “middle” position at a “middle height” with a half year of college practice under his belt. The “good” here isn’t those projected rebounding numbers. It’s that replacing the two departed upperclassmen or Mescheriakov on the boards won’t be difficult to do.

The Discouraging
  • Summers’ major contribution to the offense last year was his three-point shooting. With both he and Sapp departing, the Hoyas lose their top two three point shooters on the year. History shows: freshmen can’t shoot threes.

  • There’s not a lot of hope on the turnover front. Freshmen can’t hold onto the ball.


The Thing Not Mentioned In That Chart

  • I only have net points for last year in order to statistically evaluate defense, and the freshmen are a mixed bag. But from my eyes and general common knowledge, freshmen just aren’t very good. Just like rebounding, we have a bit of good news: according to net points, the defense was worse when Summers was on the floor. Of course, it also ranked Sapp strongly above average. I’m not sure if this says much about whether Hollis Thompson will make the defense better or worse than last year.

The Big East
  • One might expect freshman to decline in effectiveness once the Big East season gets going. But they don’t seem to do so, at least not anymore than other players. Freshmen see their ORating decline from a 103 to 101 with their poss % stable. RSCI freshman see their poss % drop 1% and their ORating drop a point. It could be that the rapid improvement disguises the increase in competition. Regardless, Hoya freshmen do not see a significant decline in effectiveness in Big East play.


What’s the sum total? Hollis Thompson is not likely to fix the Hoyas’ three point, rebounding or turnover issues. Yes, some freshmen have performed at a very high level. But it simply more likely that Thompson will perform similarly to Summers, while taking less possessions. Like in the Greg Monroe preview, look for your year over year improvement elsewhere.

What Hollis will hopefully do is put in 15-25 good minutes, play efficiently by hitting shots inside the arc, and generally replicate Summers’ efficiency, if not his usage or minutes. This is no small feat for a freshman. And, if the Hoyas take that, and then distribute the remainder of the possessions between the Big Three, the offense should improve.

Tuesday, November 3, 2009

Season Preview: Greg Monroe

Greg Monroe was the Hoyas' best player last year, and one of the very best in the country.

He led the team with a 57.6% eFG% and a 61.2% TS%. He hauled in 8.8% of the offensive rebounds, a figure topped only by Julian Vaughn in his limited minutes, and 16.7% of the rebounds on the defensive end, first on the team by a wide margin. He led the team in Stl% and had an excellent Block% as well (though Vaughn and Sims were both ahead of him in that in their limited minutes). He was second on the team in Assist Rate, though well behind Chris Wright.

There are really only two criticisms of Monroe:
  1. He's not an outside shooter - while he showed nice touch at times from the high post and hit 70% of his free throws, he only took 6 3-pointers all year.
  2. He turned the ball over a lot. While not as often as Jason Clark, he still turned the ball over on 23.8% of Hoya possessions he ended in conference, which was even more than Chris Wright did.

The question, then, is what Greg Monroe can do to perform better in what will likely be his final season wearing the Blue and Gray?


For an example of what he might be, I thought I'd look at the two final seasons on the Hilltop for the recent players he most resembles: Jeff Green and Roy Hibbert.


Of the two, Monroe more resembles Green, without the outside shot.
  • He played 76% of available minutes last season, which is 4 minutes more per game than Hibbert ever managed.
  • His rebounding stats look like Green's, not like Hibbert's.
  • He's a better shot-blocker than Green, though he's not nearly in Hibbert's class in that category.
  • He's a superlative thief of the basketball, with a steal rate double Green's but still closer to Green than Hibbert.
  • His turnover rate resembles Green's, and not Hibbert's. This confirms what we saw on the court, that stylistically Monroe is playing Green's role as a facilitator of the offense and not Hibbert's role of possession-ender.
  • He commits fouls at about Green's rate, though he draws them more at Hibbert's rate, a difference probably largely explainable by his taking more shots inside.
  • One other difference - Monroe's role in the offense, while still heavy, was more akin to Hibbert's junior year than it was to Green. Green was a high-use player from his freshman year, and slightly increased that his sophomore and junior levels.

The general topic of %Poss usage and player efficiency was discussed at length in the Freeman preview, and I won't repeat that here, but it's worth noting that between his sophomore and junior years while Green's %Poss remained fairly constant, his ORating saw a big increase, from a slightly above-average 102.7 to an excellent 114.4. This increase doesn't seem to be driven by any major changes in his player profile - he had roughly the same rebounding rates, assist rate, turnover rate (actually slightly more), steal rate and other stats, but was driven almost exclusively by major improvements in his shooting accuracy across the line:
  • from 62% to 78% on FTA
  • from 50% to 56% on 2FGA
  • from 32% to 38% on 3FGA

The question is whether or not Monroe could expect those same kind of improvements in shooting accuracy. The answer to that is: not likely.

We can further break out the shot selection in a typical season for each:
.                        2FGA
Player/Year    Dunks    Layups  Jumpers     3FGA
Green, Jeff    22/22    60/87    49/119     32/84
2006-7                  0.690    0.412      0.381

Hibbert, Roy   15/15    82/136   46/88      2 /2
2007-8                  0.603    0.523      1.000

Monroe, Greg   21/21    78/133   25/61      2 /6
2008-9                  0.586    0.410      0.333

Here we see the biggest problem with Monroe's usage - while his rate stats look like those of a Green-style facilitator, his shot selection betrays that he also served as a Hibbert-as-a-senior-style post presence.

Even if he improves his post moves and his jumper to Hibbert's level, that's still only 8-10 additional made buckets in a season based on last year's shot totals. That's definitely useful, but not the sort of change that by itself would have a major impact on the Hoyas' fortunes in 2009-10. Noticeable improvements will almost certainly not result from changes in his personal profile, but instead will be the result of the supporting cast around him being better, particularly the emergence of another post scoring threat.

[N.B. - I'm not trying to claim Greg won't better develop as an NBA prospect, or that he won't have additional skills, just that it's unlikely his level of offensive efficiency will significantly improve.]


MORE ON FREE THROWS
One of the things Monroe got a bad rap for last season was an inability to hit clutch free throws. My impression is that rap largely results from the Cincinnati game, where the Bearcats hit all 6 of their free throws in overtime and Monroe missed 3 of 4 from the line, giving the Bearcats their margin of victory.

As I noted when I wrote about free throw defense after the season, the Hoyas were lucky from a free throw luck-oriented perspective to simply make it to overtime in the first place, as the Bearcats had a below-average shooting night from the line. While Monroe made a convenient scapegoat, it's not realistic to expect him to make all of his free throws. The one game where you could fairly criticize Monroe for having a poor free throw shooting night that seriously hurt his team was the loss at Notre Dame. That game, he hit only 3 of his 7 free throws, whereas he'd have made 5 on an average night. Keep this game in mind for a minute.


The Hoyas themselves were actually pretty consistent from the line. There were two games where they made as many as 3 more free throws than you would have expected (Drexel and Seton Hall), and none where they made three fewer than you'd expect. Without more complete data, it's difficult to say for sure, but this suggests Georgetown would have won more games had opponents' free throw shooting not been unusually inconsistent. This includes both St. John's games. This is straight-up luck, pure and simple.

As I did for Hoya opponents, I also did a comparison to see which teams, if any, fouled Hoyas that were good free throw shooters and those that were worse free throw shooters. This comparison wasn't very instructive, because every Hoya who had 25 FTA on the year shot at least 70% from the line. Clark was the only Hoya who shot over 80%, which held back the Hoyas' overall team FT%, but there wasn't a single player who averaged >1 FTA/game who was bad from the line.

The bad news for 2009-10, though, is two players who the Hoyas will be looking for bigger contributions from were mediocre free throw shooters in 2009. Julian Vaughn shot 54.5% (12-22) and Henry Sims shot 58.8% (10-17). If Henry and Julian do play more minutes in 2009, Georgetown's free throw shooting may look more inconsistent than it was the previous season, simply because more non-good free throw shooters are getting shots.

And inconsistent free throw shooting can lead to some bad losses.

For the curious, here's how the Hoyas looked in each game last year in terms of offensive made free throws versus expected. Positive numbers mean the Hoyas made more free throws than their season-long average would lead you to expect, while negative numbers indicate fewer made free throws. As a reminder, the first column is calculated simply from the Hoyas' team FT%, while the second column is from the individual player FT%. The second column should be more accurate (but a lot more tedious to compute):


Opponent Team Players Jacksonville -0.0 +0.4 Drexel +3.4 +3.3 Wichita St. +1.5 +1.7 Tennessee +0.3 +0.4 Maryland +0.7 +0.3 American +1.3 +1.4 Savannah St. +0.4 +0.4 Memphis +0.8 +1.3 Mt St Marys -2.3 -2.2 Fla Int'l +2.3 +1.7 UConn +2.6 +3.0 Pitt -0.3 -0.1 Notre Dame -3.0 -2.7 Providence -1.0 -0.7 Syracuse -0.3 -0.9 Duke -2.3 -2.9 West Va. -2.1 -1.9 Seton Hall +3.7 +3.7 Cincinnati +0.7 +0.9 Marquette -1.4 -1.3 Rutgers -2.3 -2.7 Cincinnati +0.3 +0.3 Syracuse -1.9 -2.1 South Fl. +0.3 +0.4 Marquette +0.1 +0.1 Louisville -1.5 -1.4 Villanova +1.1 +0.9 St. John's -2.1 -2.4 DePaul -1.4 -1.4 SJU (BET) +0.3 +0.7 Baylor +2.1 +1.9 Total 0.0 0.1
Each column should total 0 (less any rounding errors), which they do.


Finally, here are the cumulative numbers for Hoyas and opponents combined (again, see the original discussion of FT defense for the opponents' numbers). Positive numbers represent a Hoya luck advantage, negative ones Hoya bad luck.


Opponent Team Players Game Margin Jacksonville +0.1 -0.2 +9 Drexel -1.1 -1.3 +28 Wichita St. +0.9 +0.8 +8 Tennessee -0.7 -0.2 -12 Maryland +0.8 +0.4 +27 American -0.2 +0.8 +24 Savannah St. +0.3 +1.0 +62 Memphis +0.2 +0.4 +9 (OT) Mt St Marys -0.6 -0.8 +11 Fla Int'l +4.2 +2.5 +38 UConn +1.5 +1.9 +9 Pitt +1.1 +0.9 -16 Notre Dame -6.6 -5.5 -6 Providence +0.2 -0.7 +7 Syracuse +4.6 +3.2 +14 Duke -4.8 -5.0 -9 West Va. -2.1 -2.0 -18 Seton Hall +4.0 +4.2 -5 Cincinnati -0.5 +0.7 -8 Marquette -3.7 -3.9 -12 Rutgers -3.6 -3.8 +7 Cincinnati -0.2 +0.2 -4 (OT) Syracuse -5.9 -5.9 -4 (OT) South Fl. +5.1 +5.7 +25 Marquette +1.2 +0.4 -6 Louisville -1.0 -2.0 -18 Villanova +0.4 +0.7 +2 St. John's -6.1 -7.0 -3 (OT) DePaul +0.3 +0.6 +8 SJU (BET) -4.9 -4.0 -5 Baylor +2.0 +2.3 -2 Total -15.1 -15.6

Those 4 bolded games?

Those are the Hoyas' only games of the year where free throw luck disparity played a role in the outcome of the game, and the all ended up on the Hoyas' bad side. If not for cruel fate, the Hoyas may have had two more quality road wins and avoided two bad losses. Better luck from the charity stripe alone could be the difference between another trip to the NIT and a return to the NCAA tournament in 2010.